eBooks seem to be appearing more frequently on trains and to be more talked of in educational settings but what are the trends behind these perceptions? One way of responding to this question is to use Google Trends or the “beta” Google Insights for Search. Clearly, this is only one perspective on a rather complex landscape of what people are doing in practice. I will describe some of the issues involved in using this data and the statistical tools I used (various features and contributed modules in the R “environment for statistical computing and graphics”) in a separate article. The essence of matter is that there are a whole series of biases, caveats and glossed-over statistical complexity.
Starting Out
After some tinkering with both Google Trends and Insights for Search, the facility of “Insights” to show trends filtered by categories encouraged me to opt for it rather than using “Trends” in spite of concerns about reliance on an unspecified categorisation mechanism.
The starting point is to access data for the search term “ebook” with worldwide coverage but filtered according to the “Education” category (a subcategory of “Society”). The time-based series looks like (this and all other images link to larger versions that open in a new window/tab):
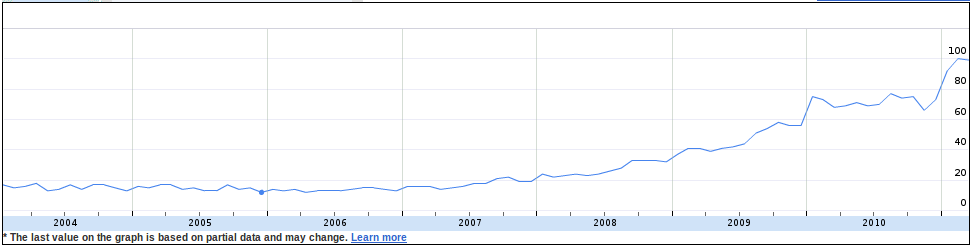
Aside from some apparently-random fluctuation, there seems to be some pattern:
- a slight decline between 2004 and early 2007
- an exponential rise from early 2007
- small steps up around year ends
Consulting the full Insights report (link above) shows two further points of interest:
- India seems to be a hotspot. NB: Google has normalised the data so this means a greater fraction of Indian searches were for “ebook” compared to fractions in other countries.
- “fac” and “ebook fac” appear to be “top searches” yet seem to be meaningless.
Digging Deeper – What is the meaning of “fac”?
Crossword enthusiasts may have already come to an intuitive conclusion which seems to be borne out by Googling for “fac”; these “top searches” look like typos for “facebook”.
So, we should modify the query to “Insights” to discount searches including “fac”, while retaining worldwide coverage and the Education filter. The resulting time-series looks like this (link to the full report):
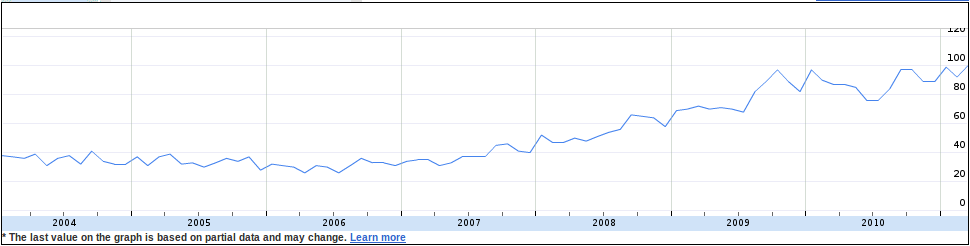
The broad trend and end-of-year seasonality seems to be still present but there seems to be more randomness and a few new features in 2009 and 2010. Having removed “fac” has also shown up some interesting new “top searches” in addition to the to-be-expected combination of “free”. “torrent” and “libre”: “toefl” and “gmat”.
Acronyms and abbreviations are often problematical to interpret as search terms but “toefl” and “gmat” have very clear meanings within an educational context.The first is the Test of English as a Foreign Language and the second is the Graduate Management Admissions Test. Both are associated with access to Higher Education and both are conducted using computer-based tests (although not exclusively). A separate investigation into trends related to these two terms might be interesting but has not been undertaken.
Decomposing “ebook -fac”: Trends, Seasonality and Transients
The time series for searches on “ebook” excluding “fac” was analysed using R (via the RKWard graphical interface). The broad question investigated was: what is the underlying smooth trend indicated by the data and what, if any, seasonal variation is there. Discrepancies between the trend + seasonality and the data might be due to random variation or transients with a particular cause.
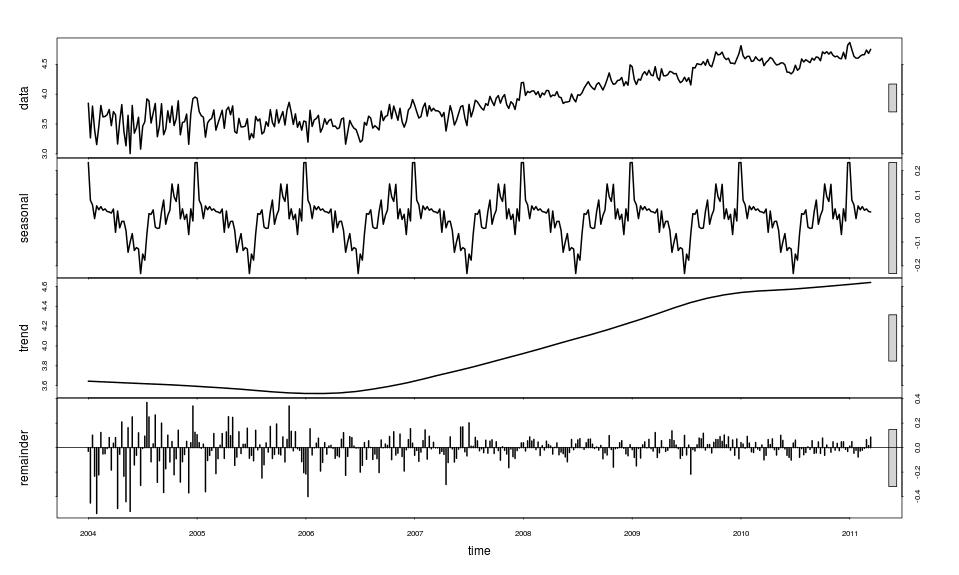
The “Seasonal Decomposition of Time Series by Loess” (Cleveland et al) was used after taking the logarithm of the count data. The outcome of this is:
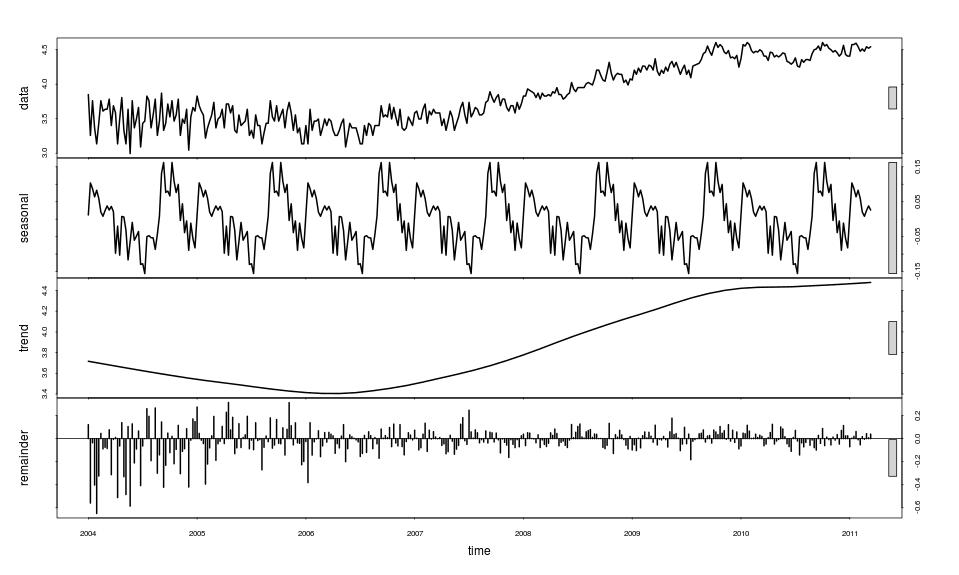
(recall that I am omitting detail from this article; jumping straight to this set of graphs is to omit quite a lot)
A number of features are becoming more clear but note that the scales for each of the four plots differ and that these plots are for a decomposition after taking logarithms:
- The data appears to be a lot more noisy. Whereas the previous plots as provided by Google are smoothed to give monthly values, the data acquired for analysis has a weekly level of granularity.
- The overall trend is in line with an intuitive response to the previous plot. The decomposition indicates a flattening of interest during 2010. We should probably wait a little longer before making confident predictions that we are entering a plateau period.
- The remainder, which is the difference between the data and the estimated (seasonal + trend), contains some extreme values in 2004 and 2005. The inability of the decomposition algorithm to handle these suggests that there was quite a lot of excitability about the topic of “ebook” among Google searchers which seems to have subsided during the strong upward trend. This suggests a solid foundation rather than hype in the latter period.
- A seasonal pattern does appear to have been detected but it is of a similar magnitude to the remainder.
A closer look at the degree of fit is not so easy using the chosen decomposition method; more sophisticated methods would give a wider range of diagnostic measures. The chosen method does, however, include an iterative procedure where difficult-to-fit data points are given lower weightings. This gives us a slightly more robust means of assessing where transient (“excitable” behaviour) or aberrant data may be. The following plot has a somewhat arbitrary vertical scale and combines the count data (weekly) as a black line with red circles indicating a degree of “transience/aberrance”:
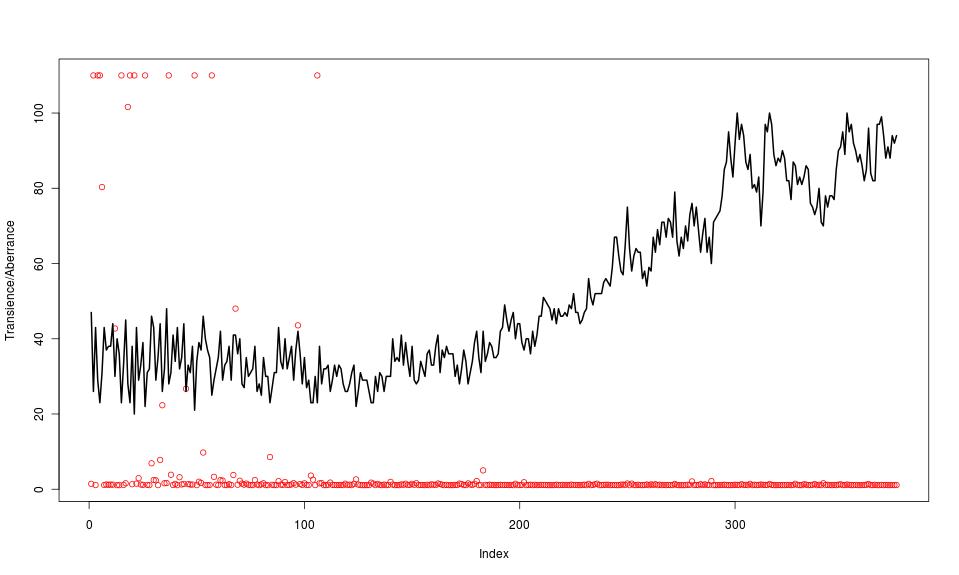 Red circles on the baseline indicate datapoints with a weighting of 1 whereas those at the top were assigned a weighting of zero. This shows that the un-fittable data was indeed located within 2004 and 2005, the period of “excitability” proposed from considering the remainders. It also confirms that the rather peaky appearance during 2010 was fitted and is not a transient (NB that, since logs were taken the seasonal graph shows a multiplier to the trend not a simple addition when we revert to looking at the count data)
It is interesting to consider the Gartner Hype Cycle at this point as did my colleague, Stephen Powell. From the above trend line and the transience apparent above, it is tempting to suggest a slightly different way of looking at it than the Gartner plot. The trough of disillusionment through to the plateau of productivity can be imagined from 2006-2011. The “hype” in the ebook data is not so much a positive bulge but a period of “excitement”, of frequent but irregular transient peaks. From the point of view of analysts, pundits and know-it-all bloggers, this might have seemed like a peak of inflated expectations but aggregate normal people and the peak is largely suppressed.
A Closer Look at the Seasonal Pattern
The magnitude of the seasonality is more easily seen if converted back from the log scale and smoothed. A 5-week moving average gives the following plot, which shows a seasonal variation of around +25% and -20% from the trend. Since logs were taken, the seasonality is expressed as a multiplication factor rather than an absolute count fluctuation.
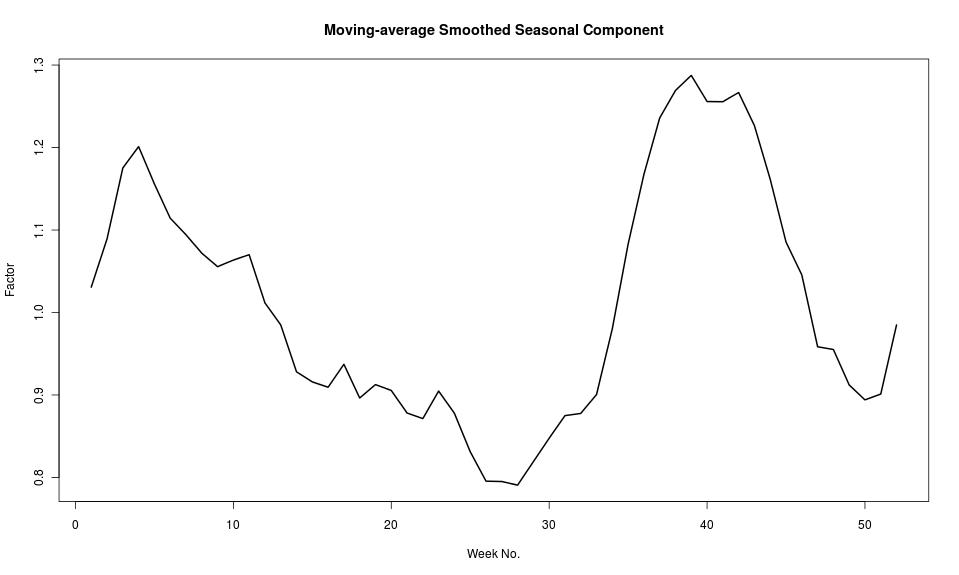
Bearing in mind that this seasonality is of a similar magnitude to the “remainder”, one should be cautious in the absence of a plausible explanation. Recall that the data was filtered according to the “Educational” category. Maybe this pattern is reflective of a broader cycle of interest in matters educational rather than ebooks per se. Could this be related to term dates in educational establishments?
Fortunately, Google Insights for Search provides the trend at the level of the entire category. Take a look at the “Growth relative to the Education category” on the Insights report page.
If the total level of activity in the Education category is used as a factor to rescale each week’s data point and the resulting values then processed as above, the following decomposition emerges:
It is quite clear that the seasonality in the “ebook -fac” case cannot be explained away by background seasonal variation in the Education category as the magnitude of seasonal variation has in fact increased. The distribution of the remainder is also seen to be similar from inspection of quartiles and mean, although a detailed analysis was not undertaken (there are thought to be too many influences to make this valid). It seems to be the case that different seasonal patterns are at work in the category as a whole and the “ebook -fac” search term. Different regions are expected to have different seasonal patterns in general so it may be the case that the observed differences reflect regional variation.
Considering One Country – the UK
One of the weaknesses of Insights is that you must choose between worldwide or single-country specific data. It is not possible to choose a set of English-speaking countries, for example, or a set of European countries. The latter poses additional challenges around mapping language-specific terms to concepts, although in the present case, “ebook” is used in non-English speaking countries alongside native language equivalents.
Focussing on one country may make the seasonal component more easily interpreted. The same method was employed, except “ebook -fac” is taken as the starting point. Insights provides the following plot (and report):

Until Spring 2008, however, Google judges there to be an insufficient search volume to provide data for each week in spite of there being a line shown in the above plot from mid-2005. The reason for this discrepancy is unclear but the consequence is that the decomposition has a start date of April 6th 2008. Without going into the details, it is again found that rescaling by the background pattern in the Education category does not magically reveal insights. Hence the unscaled decomposition is considered:
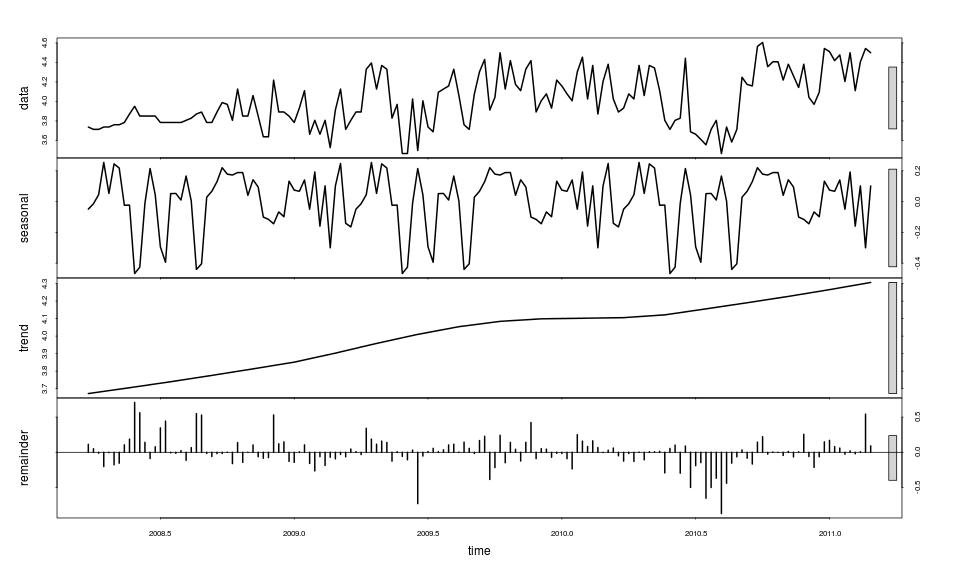
Having a shorter period to decompose means it is challenging to pick out seasonal patterns and the search volume is clearly more volatile than previously. Given the size of the remainder, it seems questionable to infer anything from the decomposed seasonality. Only two new observations seem to remain:
- there is no evidence for a plateau in the trend
- there is a clear negative deviation around June/July 2010 indicated by a cluster of sequential negative remainders. This is also borne out when looking at the weightings (the “transience/aberrance” plot)
It is tempting to suggest that there is rather more “excitability” in the UK during 2008-present than in the worldwide picture. This is rather speculative but it is thought that a low search volume alone would not account for the noisiness. The mid-2010 negative deviation is a mystery; it would be easier to explain-away a positive transient. Maybe a repeat of the analysis in 6 months time will show that we have indeed plateaued and that the transient was actually a positive one in late 2010.
Conclusions
All of the above is contestable and I encourage disputation and alternative interpretation. In terms of interesting putative observations, my top 5 are:
- India is a relative hot-spot, coupled with TOEFL and GMAT appearing with “ebook”.
- There is a possible correlation with the Gartner Hype Cycle, albeit with a revised interpretation.
- A seasonal pattern in worldwide activity remains unexplained.
- The UK seems to be “excitable” still.
- Typos have unexpected manifestations (“fac ebook”)
Finally, I’ve enjoyed dabbling with Google Insights for Search and learning quite a lot along the way, both about how to use Insights and about the handling and decomposition of time series data. I intend the next article will describe some of the “how I did it” using R.
Hi Adam
Hmm – interesting but not sure what it all means really:-) On a more pragmatic note the on of the recent JISC Curriculum Delivery projects, Duckling ( Uni of Leicester) trialled the use of ereaders/ebooks and there’s lots of good practical advice about creating and using ebooks in education @ http://www2.le.ac.uk/departments/beyond-distance-research-alliance/projects/duckling/technology-1/e-readers. Their cost benefit analysis of all the technologies they trialled is worth a look too http://www2.le.ac.uk/departments/beyond-distance-research-alliance/projects/duckling/deliverables.
Sheila
S
Pingback: Identifying Periodic Google Trends, Part 1: Autocorrelation « OUseful.Info, the blog…