Snapshots on the Changing Landscape of “Open …”

A little bit of text mining on a fairly large number of blogs with an educational technology (or technology enhanced learning…) makes a neat set of snapshots on “open …”.

Considering the words following “open” from January 2009 to the end of October 2012 shows the following distribution (where words with a relative frequency of <2% are ignored, as are low-value words like “and”). Hence it shows a share of the dominant themes.

Share of "Open ..." from Jan 2009 to Oct 2012

Share of "Open ..." from Jan 2009 to Oct 2012

The share for “online+course” is largely attributable to MOOCs and similar, although some of it is likely to be the use of “open online” referring to something else. This probably confirms the guesswork of followers of Ed Tech fashion but it may be a bit more of a surprise to see that open educational/content has taken such a tumble. I wonder whether some of the “open education” share has been diverted into “open online/course”. I’m also pleased to see “open standards” gaining more of a foothold but a left with a feeling that “open data” got a bit over-hyped in 2011.

About the data: 28116 blog posts were harvested and these contained 13723 uses of “open”. The blog post harvesting was done by the Mediabase and the analysis was done by the author, both as part of the EC funded TELMap project.

The Network of Society of Scholars (Fiction)

As preparation for the session “Emerging Reality: Making sense new models of learning organisations” at this week’s CETIS Conference (which is a session hosted by the TELMap Project), I have created the following scenario to try to make real some plausible drivers/issues/etc. The session will be debating the plausibility of these and other issues and hence their potential shapers of future learning organisations. I will emend this posting once the outcomes of the workshop are published.

The scenario is pure fiction, an informal speculation about something that might happen by around 2020-5.

The Scenario

What is a “Society of Scholars”?

A Society of Scholars is based in one or more large old houses with a combination of study-bedrooms, communal cooking and social spaces, a library and a central seminar. Students and some of the Fellows live there while many Fellows live with their families and study there.

There are no fixed courses but a framework within which depth and breadth of scholarship is guided and measured. This framework is validated by an established University, which awards the degree and provides QA (all for a fee). The Network of Societies of ScholarsTM has additional ethical codes and strict membership rules.
The physical co-location is a central part of the Society, combined with the wider (virtual) network of peers.

Genesis

Societies of Scholars sprang out of an initial “wild card” experiment where a small group of progressive academics with experience of inquiry-based learning pooled their redundancy payments from one of many rounds of staff-culling. A few sold their houses.

Their idea was to strip out the accumulation of both central services and formality of teaching and learning setting and to get back to basics while reducing cost and being able to do more of what they enjoy: thinking and talking. In doing this they hoped to attract students who were otherwise being asked to pay ever higher fees to endure ever more “commoditised” offerings and suffer poor employment prospects. The promise of high wages to pay off high debt is elusive for many who follow the conventional route. Graduate employment and student satisfaction are worse for those who opt for the newer “no frills degree course” offerings, which have cut costs without re-inventing the educational experience.

For several years they struggled to attract students but gradually a few gifted students managed to develop ultra-high web reputations started to attract more applications. The turning point was the winning of an international prize for work on “Smart Cities”, which led to a media frenzy in 2018. This triggered a spate of endowments of new Societies by successful entrepreneurs and the establishment of satellite societies to Cambridge and Oxford Universities in the UK and ETH Zurich in Switzerland with others quickly following (all recognising the threat but also the early-mover opportunity).

Character of a Society of Scholars

Societies are highly reputation conscious as are the individuals within them. They are highly effective at using the web, what we called “new media” in the naughties and in media management generally.

With the exception of assessment, Fellows and Students undertake essentially the same kind of activities; the Students strive to emulate the attitude and work of the fellows. Both divide their time between private study, informal and formal discussion. Collaboration works. There is no “Fellows teach Students”; all teach each other through the medium of the seminar. All consider “teaching the world” to be an important (but not dominating) part of what they do.

The selection process plays a key role in shaping the character of the Society. Students are admitted NOT primarily on the basis of examination grades but on evidence of self-discipline, self-awareness and especially self-directed intellectual activity.

Course and Assessment

There are no specified courses and all Students follow a unique pathway of their own. Fellows offer guidance and almost all Students piece together a collection of topics that are identifiable (e.g. similar to a conference theme, a textbook, etc). There is no fixed minimum or maximum period of study.

Societies typically focus on 3-4 disciplines but always adopt a multi-disciplinary perspective, for example computer science, electronic engineering, built environment and social theory was the combination that led to the “Smart Cities” prize.

Online resources are exploited to the fullest extent. Free or cheap MOOCs (massively open online courses, especially the form pioneered by Stanford University and udacity.com) are combined with the for-fee examinations offered alongside them.

Wikipedia is considered to be a “has been”; Society members (across the Network) and others collaborate on DIY textbooks using a system build on top of “git” (permitting multiple versions, derivatives, etc see GitHub for a “social coding” example) and a decentralised network of small servers. While being widely useful this activity is also a valued learning activity with the side effect of promoting coherence in the study pathway.

Assessment is complicated primarily by the idiosyncrasy of all pathways but also by the need to connect achievement to the breadth/depth framework. An award is typically evidenced by a mixture of: externally taught and examined modules; public examinations of the University of London; a patchwork of personal work (a “portfolio”); contributions to the DIY textbooks; seminar performance.

Demand and Expansion

Societies of Scholars are niche occupiers in a much wider higher education landscape. Demand is no more than 5% and supply  only about 3% in 2025. There is a feeling that graduates of the Societies are the “new elite”.

While some politicians call for the massification of the Society concept, society at large recognises that they need a special kind of student: more of an intellectual entrepreneur. The rise of the Society of Scholars has, however, started to change the way society understands (and answers) questions like: “what is the purpose of education?”; “how does learning happen?”… The long-term effect of this change on the face of education is not known yet (2025).

Employers in particular have understood what Societies offer and, while graduate unemployment for those following a conventional route to a degree remains close to 2012 levels, Society graduates are highly employable. Employers value: creativity, good communication skills, media-savvy people, multi-disciplinary thinking, self-motivation, intellectual flexibility, collaborative and community-oriented lifestyle.

The Drivers/Issues

This is a summary of some of the implicit or explicit assumed drivers/issues embedded in the scenario and which determine the plausibility of it (or alternatives). They are intentionally phrased as statements that could be disagreed with, argued for, …

  1. Physical co-location and (especially intimate) face-to-face interactions will continue to be seen to be an essential aspect of high quality education. Students who can afford (or otherwise access) this will generally do so. Employers will value awards arising from courses containing it more highly than those that do not. Telegraph newspaper article.
  2. Graduate unemployment will be an issue for years to come. Effective undergraduates will find ways to distinguish themselves. HESA Statistics
  3. Wikipedia (and similar centralised “web commons” services) are unsustainable in their current form. As the demand from users rises and the support from contributors and sponsors wanes (it becomes less cool to be a Wikipedian) a point of unsustainability is reached. One option is to monetise but another is to “go feral” and transition to peer-to-peer or decentralised approaches. Digital Trends article.
  4. Universities and colleges will increase the supply of course and educational components, disaggregated from “the course”, “the programme” and “the institutional offering”. Examinations, Award Granting and Quality Assurance are all potentially independent marketable offerings. David Willets article on the BBC (see “Flexible Learning”)
  5. Cheap large-scale online courses are capable of replacing a significant percentage of conventional teaching time. The “Introduction to AI” course demonstrated this: see http://is.gd/JOseb.
  6. Employers are conservative when it comes to education. While employers bemoan narrow knowledge of graduates, poor “soft skills”, etc, their shortlisting criteria continue to favour candidates with conventional degree titles and high grades from research-intensive universities. They will generally fail to take advantage of rich portfolio evidence.

Data Protection – Anticipating New Rules

On January 25th 2012, the European Commission released its proposals for significant reform of data protection rules in Europe (drafts had been leaked in late 2011). These proposals have been largely welcomed by the Information Commissioners Office , although it also recommends further thought over some of the proposals. The dramatic changes in the scale and scope of handling personal information in online retailing and social networking since the 1990’s, when current rules were implemented, is an obvious driver for change. The rise of “cloud computing” is a related factor.

What might this mean for the UK education system, especially for those concerned with educational technology?

On the whole, the answer is probably a fairly bland “not much” since we are, as a sector, pretty good at being responsible with personal data. Sector ethics, regardless of legislation, is to be institutionally concerned and careful and, providing enough time is available to adapt systems (of working and IT), this should be a relatively low impact change. There are, however, a few implications worthy of comment…

The Principle of Data Portability

Unless you know nothing about CETIS, it should come as no surprise that “data portability” caught my eye. EC Fact Sheet No. 2 says:

‘The Commission also wants to guarantee free and easy access to your personal data, making it easier for you to see what personal information is held about you by companies and public authorities, and make it easier for you to transfer your personal data between service providers – the so-called principle of “data portability”.’

Notice that this includes “public authorities”. Quite how this principle will affect practice remains to be seen but it does appear to have implications at the level of individual educational establishments and sector services such as the Learning Records Service (formerly MIAP). It is conceivable that this requirement will be satisfied by “download as HTML”, a rather lame interpretation of making it easier to transfer personal data, but I do hope not.

So: are there candidate interoperability standards? Yes, there are:

  • LEAP2A for e-portfolio portability and interoperability,
  • A European Standard, EN 15981, “European Learner Mobility Achievement Information” (an earlier open-access version is available as a CEN Workshop Agreement, CWA 16132)

These do not cover absolutely everything you might wish to “port” but widespread adoption as part of demonstrating compliance with a legislative “data portability” requirement is an option that is available to us.

It is also worth noting Principle 7 of “Information Principles for the UK Public Sector” (pdf) – see also my previous posting – which is entitled “Citizens and Businesses Can Access Information About Themselves” and recommends information strategies should go “… beyond the legal obligations” and  identify opportunities  “to proactively make information about citizens available to them by default”, noting that this would negate the cost of process and systems for responding to Subject Access Requests. I hope that this attitude is embraced and that the software is designed on a “give them everything” principle rather than “give them the minimum we think the law requires”. Software vendors should be thinking about this now.

There are some interesting possibilities for learner mobility if learners have a right to access and transfer fine grained achievement and progress information, especially where that is linked to well defined competence (etc) structures. Can we imagine more nomadic learners, especially those who may be early adopters of offerings from the kind of new providers that David Willetts and colleagues are angling for?

The Right to be Forgotten

This right is clearly aimed squarely at the social network hubs and online retailers (see the EC Fact Sheet No.3, pdf). It isn’t very  likely that anyone would want to have their educational experiences and achievements forgotten unless they plan to “vanish”. Indeed, it would be surprising if existing records retention requirements would be changed and the emerging trend of having secure document storage and retrieval services under user control – e.g. DARE – seems set to continue and be the way we manage this issue cost-effectively.

The right to be forgotten may be more of a threat to realising the “learning analytics” dream, even if only in adding to existing uncertainty, doubt and sometimes also fear. We need some robust and widely accepted protocols to define legally and ethically acceptable practice.

Uniformity of Legislation

The national laws that were enacted to meet the existing data protection requirements are all different and the new proposals are to have a single uniform set of rules. This makes sense from the point of view of a multi-nation business, although it will not be without critics. This is just one factor that could make a pan-European online Higher Education initiative easier to realise, whether a single provider or a collaboration. I perceive signs that people are moving closer to viable approaches to large scale online distance education using mature technologies, and possibly English as the language of instruction and assessment; looming “low-end disruptions” (see the Wikipedia article on “Disruptive Innovation“) for the academy as we know it. [Look out for an interview with Seb Schmoller which has influenced my views, due to be published soon on the JISC Observatory website.]

This is, of course, just some initial impressions on some proposals. I am sure there is a great deal that I have missed from a fairly quick scan of material from the commission and there is bound to be a lot of carping from those with businesses built around exploiting personal data so the final shape of things might be quite different.

Preparing for a Thaw – Seven Questions to Make Sense of the Future

“Preparing for a Thaw – Seven Questions to Make Sense of the Future” is the title of a workshop at ALT-C 2011. The idea of the workshop was to use a simple conversational technique to capture perspectives on where Learning Technology might be going, hopes and fears and views on where education and educational technology should be going. The abstract for the workshop (ALT-C CrowdVine site) gives a little more information and background and there is also a handout available that extends this. The workshop had two purposes: to introduce participants to the technique with a view to possible use in their organisations; to gather some interesting information on the issues and forces shaping the future of learning technology. All materials have Creative Commons licences.

The short version of the Seven Questions used in the session (it is usual to use variants of one form or another) are:

  • Questions for the Oracle about 2025 [what would you ask?]
  • What would be a  favourable outcome by 2025?
  • What would be an unfavourable outcome?
  • How will culture and institutions need to change?
  • What lessons can we learn from the past?
  • Which decisions need to be made and actions taken?
  • If you had a “Magic Wand”, what would you do?

Fourteen people, predominantly from Higher Education, attended the workshop; their responses to the “Seven Questions” are all online at http://is.gd/7QResponses and there is an online form to collect further responses at http://is.gd/7Questions that is now open to all. This blog post is a first reaction to the responses made during the workshop, where a peer-interviewing approach was used. A more considered analysis will be conducted on September 14th, taking account of any further responses gathered by then.

Wordle of all responses to the "Seven Questions" that were made during the ALT-C 2011 workshop. (NB: four words have been eliminated - "learning", "education", "technology", "technologies")
Wordle of all responses to the “Seven Questions” that were made during the ALT-C 2011 workshop. Click image to open full-size.
(NB: four words have been eliminated – “learning”, “education”, “technology”, “technologies”)

My quick take on the responses is that there are about half a dozen themes that recur and a few surprising ideas. These appear to be:

  • Universal and affordable access to education and the avoidance of a situation where access to technological advances favours one section of society (or region) was a concern. There was support for ensuring access to connectivity and hardware for everyone, that this should be an entitlement. This was a very strong theme in the “if you had a magic wand” responses.
  • The need for improved digital literacies amongst teaching staff but also across the institution as a whole came out several times. Similarly (but distinct from this) is a desire to be more effective with teacher education and staff development.
  • There were questions about whether there would be “learning technologies” in 2025 and whether there would still be “learning technologists”, at least as defined by their current role.
  • The transformation of assessment and accreditation was also drawn out as an uncertainty.
  • Several responses wondered about the dominant devices that would be used in 2025 and the kind of interface (mouse, gesture,… what next?).
  • An increasing potential role for using data was tempered by concerns about unethical or exploitative use of collected data.
  • There was interest in multi-direction, collaborative education and the role of technology in that.
  • The risk of educational institutions holding onto established (old) models came out several times.
  • I wasn’t the only person to mention “interoperability”.

The workshop participants seemed to enjoy the approach and I was pleased at how well the peer interviewing worked, although I can see that this might not be right for all groups. I’ll also be watching out for differences in response that might be present between peer interview and solo completion of the online form. 1 hour for introduction, reciprocal interviews and closing discussion was rather restrictive but it seems to have surfaced some good materials and it certainly gave a good indication of what could be achieved with a little more time.

A more considered and detailed write-up will be published soon; I’ll add a comment.

Weak Signals and Text Mining II – Text Mining Background and Application Ideas

Health warning: this is quite a long posting and describes ideas for work that has not yet been undertaken.

My previous post gave a broad introduction to what we are doing and why. This one explores the application of text mining after a brief introduction to text mining techniques in the context of a search for possible weak signals. The requirements, in outline, are that the technique(s) to be adopted should:

  • consume diverse sources to compensate for the surveillance filter;
  • strip out the established trends, memes etc;
  • not embed a-priori mental models;
  • discriminate relevance (reduce “noise”).

Furthermore, the best techniques will also satisfy aims such as:

  • replicability; they should be easily executed a number of times for different recorded source collections and longitudinally in time.
  • adoptability; it should be possible for digitally literate people to take up and potentially modify the techniques with only a modest investment in time to understand topic mining techniques.
  • intelligibility; what it is that the various computer algorithms do should be communicable in language to an educated person.
  • parsimony; the simplest approach that yields results (Occam’s Razor) is preferred.
  • flexibility; tuning, tweaking etc and an exploratory approach should be possible.
  • subjectible to automation; once a workable “machine” has been developed we would like to be able to treat it as a black box either with simple inputs and outputs or that can be executed at preset time intervals.

The approach taken will be less elaborate than the software built by Klerx (see “An Intelligent Screening Agent to Scan the Internet for Weak Signals of Emerging Policy Issues (ISA)“) but his paper has influenced my thinking.

Finally: this is not text mining research and the findings of importance are about technology enhanced learning.

Data Mining Strategies

Text mining is  not a new field and is one which has rather fuzzy boundaries and various definitions. As far back as 1999, Hearst considered various definitions (“Untangling Text Data Mining“)  in what was then a substantially less mature field. As the web exploded, more applications and more implied definitions have become apparent. I will not attempt to create a new definition nor to adopt someone else’s, although Hearst’s conception of “a process of exploratory data analysis that leads to the discovery of heretofore unknown information, or to answers to questions for which the answer is not currently known” nicely captures the spirit.

The methods of data mining, of which text mining is a part, can be crudely split into two:

  • methods based on an initial model and the deduction of the rules or parameters that fit the data to the model. The same strategy is used to fit experimental data to a mathematical form in least squares fitting, for example to an assumed linear relationship.
  • methods that do not start with an explicit model but use a more inductive approach.

Bearing in mind our requirement to avoid a priori mental models, an inductive approach is clearly most appropriate. Furthermore, to adopt a model-based approach to textual analysis is a challenging task involving formal grammars, ontologies, etc and would fail the test of parsimony until other approaches have been exhausted. Finally: even given a model-based approach to text analysis it is not clear that models of the space in which innovation in technology enhanced learning occurs are tractable; education and social change are deeply ambiguous, fuzzy and relevant theories are many, unvalidated and often contested. The terms “deductive” and “inductive” should not be taken too rigidly, however, and I am aware that they may be applied to different parts of the methods described below.

Inductive approaches, sometimes termed “machine learning“, are extensively used in data mining and may again be subjected to a binary division into:

  • “supervised” methods, which make use of some a priori knowledge, and
  • “unsupervised methods which just look for patterns.

Supervision should be understood rather generally; the typical realisation of supervision is the use of a training set of data that has previously been classified, related to known outcomes or rated in some way. The machine learning then involves induction of the latent rules by which new data can be classified, outcomes predicted etc. This can be achieved using a range of techniques and algorithms, such as artificial neural networks. A supervised learning approach to detecting insurance fraud might start with data on previous detected cases to learn the common features. A text mining example is the classification of the subject of a document given a training set of documents with known subjects.

Unsupervised methods can take a range of forms and the creation of new ones is a continuing research topic. Common methods use one of several definitions of a measure of similarity to identify clusters. Whether or not the algorithm divides a set in successive binary splits, aggregates into overlapping or non-overlapping clusters. etc will tend to give slightly different results.

From this synopsis of inductive approaches it seems like we do not have an immediately useful strategy to hand. By definition, we do not have a training set for weak signals (although it could be argued that there are latent indicators of a weak signal and that we would gain some insight by looking at the history of changes that were once weak signals). The standard methods are oriented towards finding patterns, regularities, similarities, making predictions given previous patterns, which are not weak signals by definition.

For discovery of possible weak signals, it appears that we need to look from the opposite direction: to find the regularities so that they can be filtered out. Another way of expressing this is to say that it is outliers that will sometimes contain the information we most value, which is not usually the case in statistics. A concise description of outliers from Hawkins is sensible to our weak signals work as it is to general statistics: “an observation that deviates so much from other observations as to arouse suspicion that it was generated by a different mechanism” (Identification of outliers / D.M. Hawkins ISBN:041221900X). Upon this, a case for exclusion of outliers in a statistical treatment may often be built whereas for us it is a pointer to a subject for further exploration, dissemination or hypothesis.

Actually, it is likely to be more subtle than simply filtering out regularities and to require some cunning in the design of our mining process. I will describe some ideas later. Some of these describe a process that will filter out the largest regularities while retaining just-detectable ones; maybe a larger dataset than a human can reasonably absorb will show these up. Others will look at differences in the regularities between different domains. Following from this, it is not the case that finding regularities is bad, rather that it may be necessary to stray a little from normal practice, although borrowing as much as possible. “Two Non-elementary Techniques”, below, briefly outlines two relevant approaches to finding structure.

Ensembles

It should be quite clear that any kind of search for potential weak signals is beset by indeterminacy inherent in the socio-technical world in which they arise. I contend that any approach to finding such signals is also easily challenged over reliability and validity. Referring back to “Weak Signals and Text Mining I”, the TELMap human sources (Delphi based) and recorded sources (text mining based) will do the best they can but neither will be able to mount a robust defence of any potential weak signal except in retrospect. This is why we say “potential” and emphasise that discourse over such signals is essential.

One way of mitigating this problem is to take inspiration from the use of “ensembles” in modeling and prediction in complex systems such as the weather. The idea is quite simple; use a range of different models or assumptions and either take a weighted average or look for commonality. The assumption is that wayward behaviour arising from approximations and assumptions, which are practically necessary, can be caught.

A slightly different perspective on dealing with indeterminacy is expressed by Petri Tapio in “Disaggregative policy Delphi Using cluster analysis as a tool for systematic scenario formation” (Technological Forecasting & Social Change 70 (2002) 83 – 101):

“Henrion et al. go as far as suggesting to run the analysis with all available clustering methods and pick up the one that makes sense. From the standard Popperian deductionist point of view adopted in statistical science, this would be circular reasoning. But from the more Newtonian inductionist point of view adopted in many technical and qualitatively oriented social sciences, experimenting [with] different methods would also seem as a relevant strategy, because of the Dewian ‘learning by doing’ background philosophy.”

The combination of these two related ideas will be adopted:

  • Bearing in mind the risk of re-introduction of the “mentality filter” (see part I), various methods and information sources will be experimented with to look for what “makes sense”. In an ideal scenario, several people with different backgrounds would address the same corpus to compensate for the mentality filter of each.
  • Cross-checking between the possible weak signals identified in the human and recorded sources approaches and between text mining results (even those that don’t “make sense” by themselves) will be undertaken to look for more defensible signals by analogy with ensemble methods.

Having a human in the process – seeing what makes sense – should help to spot juxtaposition of concepts, dissonance to context, … etc as well as seeing when the method just seems to be working. It will also help to eliminate false-positives, e.g. an apparently new topic might actually be a duplicated spelling mistake.

A Short Introduction to Elementary Text Mining Techniques

The starting point, whatever specific approach is adopted, will always be to process some text, which will be referred to as a “document” whether or not this term would be used colloquially, to generate some statistics upon which computation can occur. These statistics might be quite abstract measures used to assess similarity or they might be more intelligible. On the whole, I prefer the latter since the whole point of the work is to find meaning in dis-similarity. The mining process will consider a large number, where “large” may start in the hundreds, of documents in a collection from a particular source. The term “corpus” will be used for collections like this.

I will be drawing from standard toolkit of text processing to get from text to statistics, comprising the separate operations described below. These are “elementary” in the sense that they don’t immediately lead us to useful information. They are operations suited to a “bag of words” treatment, which seems quite crude but is common practice; it has been shown to be good enough for a many applications, it is computationally tractable with quite large corpora and it lends itself to relatively intelligible results. In “bag of words“, the word order is almost totally neglected and there is no concept of the meaning of a sentence. The meaning of a document becomes something that is approached statistically rather than through the analysis of the linguistic structure of sentences. Bag-of-words is just fine for our situation as we don’t actually want the computer to “understand” anything and we do want to apply statistical measures over moderate-sized corpora.

“Stop Word” Removal

Some of the words used in a document indicate little or nothing of what the document is about in a bag-of-words treatment, although they may be highly significant in a sentence. “No” is a good example of a word with different significance at sentence and bag-of-words levels. It is easy to call other examples to mind: or, and, them, of, in… In the interest of processing efficiency and the removal of meaningless and distracting indicators of similarity/difference, stop words should be removed at an early stage rather than trying to filter out what they cause later in the process. Differences in the occurrence of stop words can be considered to be 100% “noise” but they are easily-filtered out at an early stage. Standard stop-word lists exist for most languages and are often built into software for text mining, indexing, etc. It is possible that common noise-words will be discovered while looking for possible weak signals but these can be added to the stop-list.

Tokenisation

Tokenisation involves taking a stream of characters – letters, punctuation, numbers – and breaking it up into discrete items. These items are often what we would identify as words but they could be sentences, fixed length chunks or some other definable unit. Sometimes so-called “n-grams” are created in tokenisation. I will generally use single word tokens but some studies may include bi-grams or tri-grams. For example, all of the following might appear as items in a bag-of-words using bi-gram tokenisation: “learning”, “design”, “learning design”.

Part-of-Speech Tagging and Filtering

For the analysis of meaning in a sentence, the tagging of the part of speech (POS) of each word is clearly important. For the bag-of-words text mining it will not be so. I expect to use POS tagging in only a few applications (see below). When used, it will probably be accompanied by a filtering operation to limit the study to nouns or various forms of verb (VB* in the Penn Treebank POS tags scheme) in the interest of relevance discrimination.

Stemming

Many words change according the part of speech and have related forms but which effectively carry similar meaning in a bag of words. For example: learns learner, learning, learn. This will generally equate to “noise”, at best a minor distraction and at worst something that hides a potential weak signal by dissipating a detectable signal concept into lexically-distinct terms. In general it is statistically-desirable to reduce the dimensionality of variables, especially if they are not independent, and stemming does this since each word/term occurrence is a variable.

The standard approach is “stemming”, which reduces related words to what is generally the starting part of all of the related words (e.g. “learn” but it often leads to a stem that is not actually a word). There are a variety of ways this can be done, even within a single language. The Porter stemmer is widely used for English.

Document Term Statistics

A simple but practically-useful way to generate some statistics is to count the occurrence of terms (words or n-grams having been filtered for stop-words and stemmed). A better measure, which compensates for the differences in document length is to use the term frequency rather than the count; term frequency may be expressed as a percentage of the terms occurring in the document that are of a given type. Sometimes a simple yes/no indicator of occurrence may be useful.

A potentially more interesting statistic for a search for possible weak signals is the “term frequency inverse document frequency” (td-idf). This opaquely-named measure is obtained by dividing the term frequency by the logarithm of the fraction of documents that contain the term. This elevates the measure if the term is sparsely distributed among documents, which is exactly what is needed to emphasise outliers.

Given one of these kinds of document item statistic it is possible to hunt for some interesting information. This might involve sorting and visually-reviewing a table of data, resort to a graphical presentation, some ad-hoc recipe,  use of a structure-discovery algorithm (e.g, clustering)  that computes a “distance measure” between documents from the item statistics, … or a combination of these.

Synonyms, Hyponyms, …

For the reasons outlined in the section on stemming, it can be helpful to reduce the number of terms by mapping several synonyms onto one term or hyponyms onto their hypernym (e.g. scarlet, vermilion, carmine, and crimson are all hyponyms of red). The Wordnet lexical database contains an enormous number of word relationships, not just synonyms and hypo/hyper-nyms. I do not intend to adopt this approach, at least in the first round of work, as I fear that it will be hard to be a master of the method rather than the reverse. For example, wordnet makes imprinting be a hyponym of learning –  “imprinting — (a learning process in early life whereby species specific patterns of behavior are established)” – which I can see as a linguistically sensible relationship but one with the unintended consequence of suppressing potential weak signals.

An alternative use of Wordnet (or similar database) would be to expand one or more words into a larger set. This might be easier to control and would quickly generate what could be used as a set of query terms, for example to search for further evidence once a possible weak signal shortlist has been created. One of my “Application Scenarios”, below, proposes the use of expansion.

Two Non-elementary Techniques

The section “Data Mining Strategies” outlined some of the strengths and weaknesses of common approaches in relation to our quest for possible weak signals. It stressed the need to work with methods that focus on finding structure and regularities alongside a search for outliers. Two relevant techniques that go beyond the relative simplicity of the elementary text mining techniques outlined above are clustering and topic modeling. “Topic modeling” is a relatively specific term whereas “clustering” covers more diversity.

Clustering methods – many being well-established – may be split into three categories: partitioning methods, hierarchical methods and mapping methods. These usually work by computing a similarity (or distance between) the items being clustered. In our case it is the document term statistics that will give a location for each document.

The hierarchical approach is expected to make visible the most significant structure viewed from the top down (although the algorithms work from the bottom up in “aggregative” hierarchical clustering) and so not to lend itself to a search for possible weak signals although it is appropriate for scientific studies and for document subject classification where we naturally use hierarchical taxonomies.

Partitioning does not coerce the structure into a hierarchy and so may be expected to leave more of the detail in place. There are a number of different objectives that may be chosen for partitioning and potentially several algorithms for each. The “learning by doing” philosophy noted in the section “Ensembles” will be adopted. An old but useful description of the mathematics of some established clustering algorithms has been provided by Anja Struyf, Mia Hubert, Peter Rousseeuw in the Journal of Statistical Software Vol 1 Issue 4.

Hierarchical and partitioning approaches have been popular for many years whereas mapping approaches are a more recent innovation, probably due to greater computing power requirements. Self Organising Maps and Multi-dimensional scaling are two common “mapping approaches”. They are probably best understood by thinking of the problem of representing the document term statistics (a table with many columns, each representing the occurrence of terms, and many rows, one for each document) in two dimensions. This is clustering in the sense that aspects of sameness among the ‘n’ dimensions of the columns are aggregated. Although this process of dimension-reduction has the desirable property of making the data more easy to visualise, it is may be unsuitable for the discovery of possible weak signals.

Clustering is a stereotype unsupervised learning approache; there is no embedded model of the data. All that is needed is a means to compute similarity, hence the same methods can be applied to experimental data, text etc. Topic Modeling, however, introduces a theory of how words, topics and documents are related. This has two important consequences: the results of the algorithm(s) may be more intelligible; the model constrains the range of possible results. The latter may be either desirable or undesirable depending on the validity of the model. Intelligibility is improved because we are able to better relate to the concept of a topic than we are to some abstract statement of statistical similarity.

Probabalistic Topic Models (see Steyvers and Griffiths, pdf) assume a bag of words, each word having a frequency value, can be used to capture the essence of a topic. A given document may cover several topics to differing degrees leading to a document term frequency in the obvious way. The statistical inference required to work backwards from a set of documents to a plausible set of topics and the generation of the word frequency weightings for each topic and topic percentages in each document requires some mathematical cunning but has been programmed for R (see Grün and Hornik topicmodels package) as well as MATLAB (see Mark Steyvers’ toolbox).

Probablistic Topic Models could be useful to attenuate some of the noisiness expected with approaches working purely at the document-term level. This might make identification of possible weak signals easier; “discriminate relevance” was how it was phrased in the statement of requirements above. It is expected that some tuning of parameters, especially the number of topics, will be required. There is also a random element in the algorithms employed. This means that the results between different runs may be different. The margin of the stable part of the results may well contain pointers to possible weak signals. As for clustering, a “learning by doing” approach will be used, taking care not to introduce a mentality filter.

Sources of Information for Mining

One of the premises of text mining is access to relatively large amounts of information and the explosion of text on the web is clearly a factor in an increasing interest in text mining over the last decade and a half. There are both obvious and non-obvious reasons why an unqualified “look on the web” is not an answer to the question “where should I look for possible weak signals”. Firstly, the web is simply too mindbogglingly big. More subtly, it is to be expected that differences in style and purpose of different pieces of published text would hide possible weak signals; some profiling will be required to create corpora that contain comparable documents within each. Finally, crawling web pages and scraping out the kernel of information is a laborious and unreliable operation when you consider the range of menus, boilerplate, advertisements, etc that typically abound.

Three kinds of source get around some of these issues:

  • blogs occur with a reduced range of style and provide access to RSS feeds that serve-up the kernel of information as well as publication date;
  • journal abstracts generally have quite a constrained range of style, are keyword-rich and can be obtained using RSS or OAI-PMH to avoid the need for scraping;
  • email list archives are not so widely available as RSS (but this is sometimes available) and there is often stylistic consistency, although quoted sections, email “signatures” and anti-spam scan messages may present material in need of removal.

My focus will be on blogs and journal abstracts, which are expected to generally contain different information. RSS and OAI-PMH are important methods for getting the data with a minimum of fuss but are not the panacea for all text acquisition woes. RSS came out of news syndication and to this day RSS feeds serve up the most recent entries. Any attempt to undertake a study that looks at change over time using RSS to acquire the information will generally have to be conducted over a period of time. Atom, a later and similar feed grammar, is sometimes available but not the paging and archival features imagined in RFC5005. Even RSS feeds provided by journal publishers are limited to the latest issue and usually no obvious means to hack a URL to recover abstracts from older issues. The OAI-PMH provides a means to harvest abstract (etc) information over a date range and there is even an R package that implements OAI-PMH but many publishers do not offer OAI-PMH access.

A final problem which is specific to blogs is how to garner the URLs for the blogs to be analysed. It seems that all methods by which a list could be compiled are flawed; the surveillance and mentality filters seem unavoidable.

The bottom line is: there will be some work to do before text mining can begin.

On Tools, Process and Design…

The actual execution of the simple text mining approaches outlined in the “short introduction” is relatively straight-forward. There are several pieces of software, both code libraries/modules and desktop applications, that can be used after a little study of basic text mining techniques. I plan on using R and the “tm” package (Feinerer et al) for the “elementary” operations and RapidMiner. The former requires programming experience whereas the latter offers a graphical approach similar to Yahoo Pipes. In principle, the software used should be independent of the text mining process it implements, which can be thought of in flow-chart terms, so long as standard algorithms (e.g. for stemming) are used. In practice, of course, there will be some compromises. The essence of this is that the translation from a conceptual to an executable mining process is an engineering one.

The critical, less-well-defined and more challenging task is to decide how the toolkit of text-mining techniques will be applied. This starts with considering what text sources will be used, moves through how to “clean” text and then to how tokenisation, term frequency weights etc will be used and concludes with how clustering (etc) and visualisation should be deployed. In a sense, this is “designing the experiment” – but I use the term “application scenario” – and it will determine the meanignfulness of the results.

Some Application Scenarios

This section speculates on a number of tactics that might yield possible weak signals. The title of application scenario will be used as its name. Future postings will develop and apply one or more of these application scenarios.

Out-Boundary Crossing

Idea: Strong signals in other domains are spotted by a minority in the TEL domain who see some relevance of them. Discover these.

Notes: The signal should be strong in the other domain so that there is confidence that it is in some sense “real”.

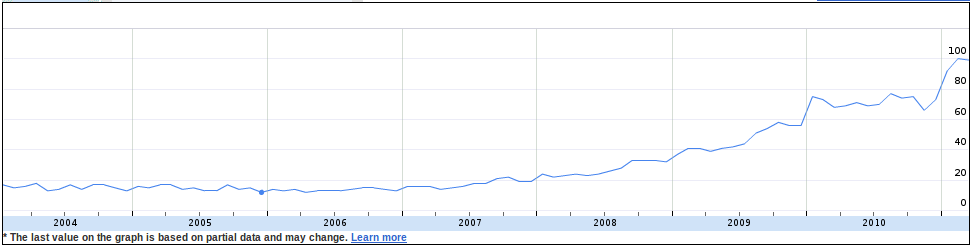
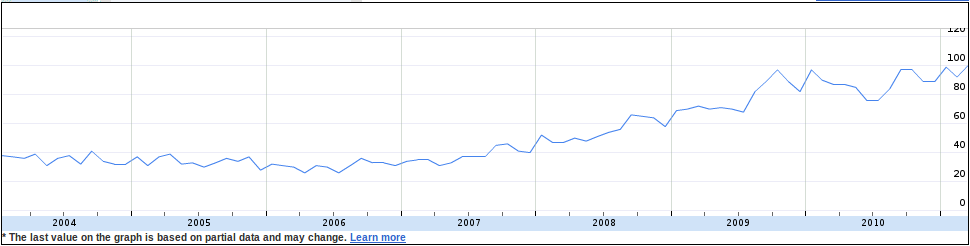
Operationalisation: Extract low-occurrence nouns from a corpus of TEL domain blog posts and cross-match to search term occurrence in Google Trends.

Challenges: Google Trends does not provide an API for data access

In-Boundary Crossing

Idea: Some people in another domain (e.g. built environment, architectural design) appear to be talking about teaching and learning. Discover what aspect of their domain they are relating to ours.

Notes: This approach clearly cannot work with text from the education domain.

Operationalisation: Use Wordnet to generate one or more sets of keywords relevant to the practice of education and training. Use a corpus of journal abstracts (separate corpora for different domains) and identify documents with high-frequency values for the keyword set(s).

Challenges: It may be difficult to eliminate papers about education in the subject area (e.g. about teaching built environment) other than by manual filtering.

Novel Topics

Idea: Detect newly emerging topics against a base-line of past years.

Notes: This  is the naive application scenario, although there are many ways in which it can be operationalised.

Operationalisation: Against a corpus of several previous years, how do the topics identified by Probabilistic Topic Modeling correlate with those for the last 6 months or year. Both TEL blogs and TEL journal abstracts could be considered.

Challenges:It may be difficult to acquire historical text that is comparable – i.e. not imbalanced due to differences in source or due to quantity.

Parallel Worlds

Idea: There may be different perspectives between sub-communities within TEL: practitioners, researchers and industry. Identify areas of mismatch.

Notes: The mismatch is not so much a source of possible weak signals as an exploration of possible failure in what should be a synergy between sub-communities.

Operationalisation: Compare the topics displayed in email lists for institutional TEL champions, TEL journal abstracts and trade-show exhibitor profiles.

Challenges: Different communities tend to use communications in different ways: medium, style, etc, which is reflected in the different text sources. This may well over-power the capabilities of text mining. Web page scraping will be required for exhibitor profiles and maybe email list archives.

Rumble Strip

A “rumble strip” provides an alert to drivers when they deviate.

Idea: Discover differences between a document and a socially-normalised description of the same topic.

Notes: –

Operationalisation: Use an online classification services (e.g. OpenCalais) to obtain a set of subject “tags” for each document. Retrieve and merge the wikipedia entries relevant to each. Compare the document term frequencies for the original document and the merged wikipedia entries.

Challenges: Documents are rarely about a single topic; the practicability of this application scenario is slim.

Ripples on the Pond

Idea: A new idea or change in the environment may lead to a perturbation in activity in an established topic.

Notes: Being established is key to filtering out hype; these are not new topics.

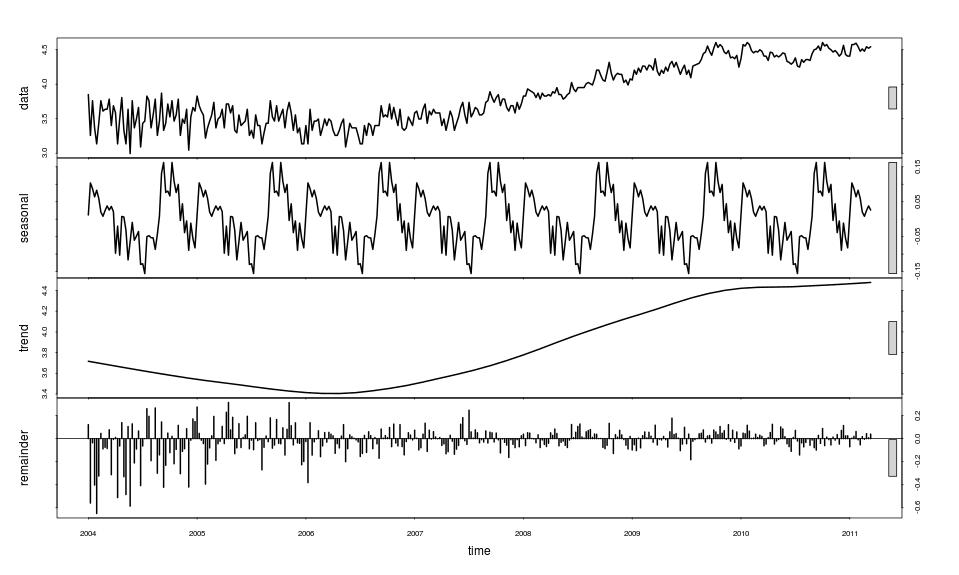
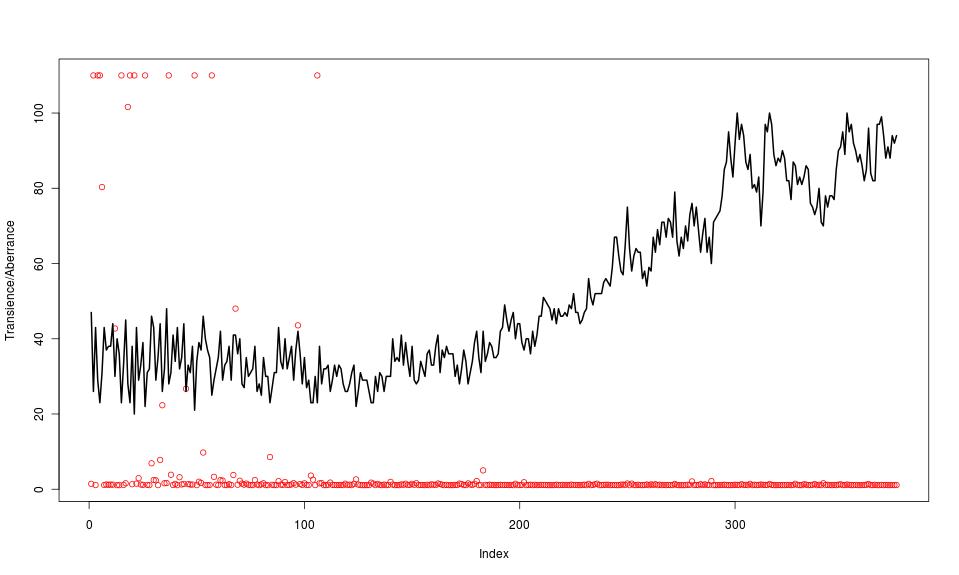
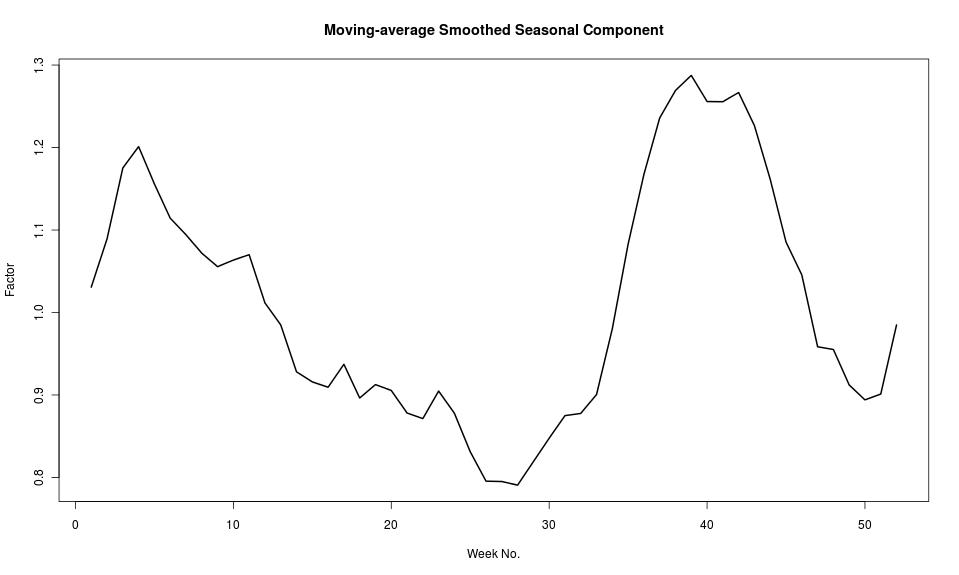
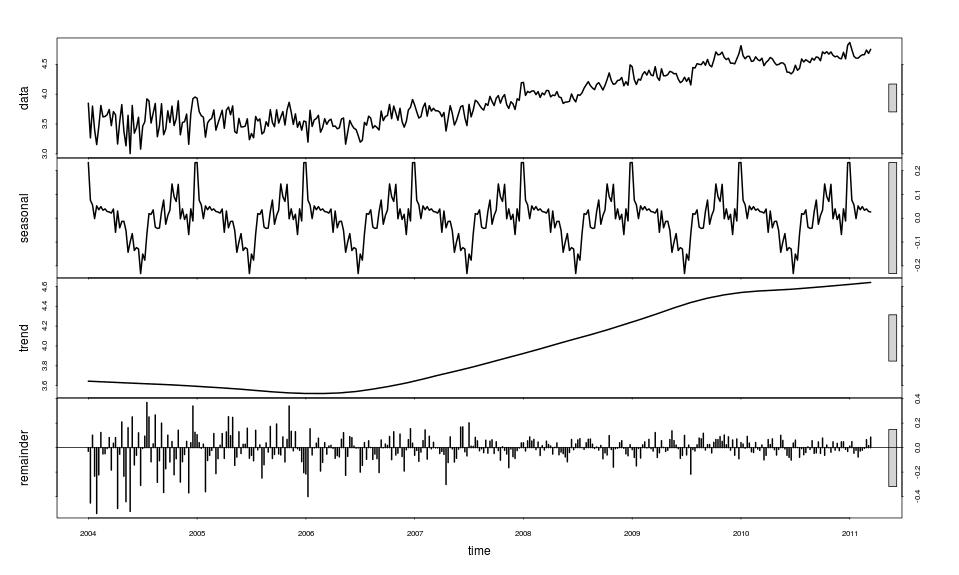
Operationalisation: Identify some key-phrase indicators for established topics (e.g. “learning design”). Mine journal abstracts for the key phrase and analyse the time series of occurrence. Use OAI-PMH sources to provide temporal data.

Challenges: The results will be sensitive to the means by which the investigated topics are decided.

Shifting Sands

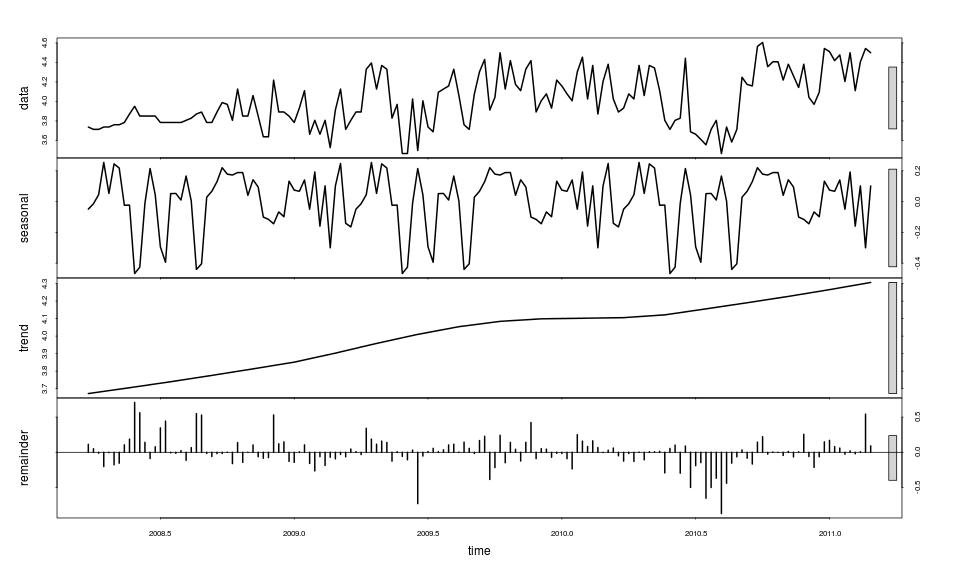
Idea:Over time the focus within a topic may change although writers would still say they are talking about the same subject. Discover how this focus changes as a source of possible weak signals.

Notes: Although the scenario considers an aggregate of voices in each time period, the voices of individuals may be influential on the results.

Operationalisation: Use key-phrases as for “Ripples on the Pond” but use Probabilistic Topic Modeling with a small number of topics. Analyse the drift in the word-frequencies determined for the most significant topics.

Challenges: –

Alchemical Synthesis

Idea:Words being newly-associated may be early signs of an emerging idea.

Notes: –

Operationalisation: Using single-word nouns in the corpus, compute an uplift for n-grams that quantifies the n-gram frequency compared to what it would be by chance. Sample a corpus of TEL domain blog posts and look for  bi-grams or tri-grams with un-expected uplift.

Challenges: –

Final Remarks

As was noted at the start, the implementation of these ideas is not yet undertaken. I may be rash in publishing such immature work but I do so in the hope that constructive criticism or offers of collaboration might arise.

There is much more that could be said about issues, challenges and what is kept out of scope but two warrant comment: I am only looking at text in English and recognise that this gives a biased set of possible weak signals; there are other analytical strategies such as social network analysis that provide interesting results both independently of and along side the kind of topic-oriented analysis I describe.

I hope to be able to report some possible weak signals in due course for comment and debate. These may appear on the TELMap site but will be signposted from here.

Weak Signals and Text Mining I – An Introduction to Weak Signals

“Weak Signals” is a rather fashionable term used in parts of the future-watching community, although it is an ill-defined term as evidenced by the lack of a specific entry in Wikipedia (there is only a reference under Futurology). There is an air of mystique and magic about Weak Signals Analysis that turns some people off, me included, but I have come to the conclusion that a sober interpretation of the idea can be provided. This is what we are trying to do in a work package led by the Zentrum für Soziale Innovation (strapline “all innovations are socially relevant”) in the TELMap project. This work combines two approaches: one with direct engagement with people, our “human sources” track, and one looking at “recorded sources”, i.e. existing written texts. My area of interest, and that of colleagues at RWTH Aachen University is in the recorded sources. This post provides an introduction to the work, I hope a sober interpretation of “weak signals”, and a following post will outline some initial ideas about how text mining might be used.

A Weak Signal is essentially a sign of change that is not generally appreciated. In some cases the majority of experts or people generally would dismiss it as being irrelevant or simply fail to notice it. In these days of social software and ubiquitous near-instantaneous global communication the focus is generally on trends, memes, etc. Thought leaders of various kinds – individuals and organisations – wield huge power over the focus of attention of a following majority. The act of anticipating what the next trend/meme/etc will be could be construed as looking for a weak signal. There are a number of problems with identifying these and a naive approach is bound to fail; for example, to ask people to “tell me some weak signals” is equivalent to asking them to tell of something they think is irrelevant which might be important. Neither can you ask the experts, by definition. The point here is that the person who spots a sign of change may well be an outsider, on the periphery or be in a despised sub-culture.

In spite of Weak Signals being a problem concept, the fact remains that to anticipate change would give an innovator an advantage and potentially help an agent in the mainstream to avoid being blind-sided. To make even a small contribution here is part of the mission of both TELMap and CETIS. Our intention is to divert some attention away from the hot topics of the day and to discover some neglected perceptions or ideas that are worthy of more attention, both social attention and analytical investigation. This intention, and an assertion that we only ever consider Possible Weak Signals, is my “sober interpretation”. There is no magic here, no shamanic trance leading to revelation.

There is ample literature around the topic of Weak Signals but I will only mention a couple. Elina Hiltunen is a well-known figure, see for example some slides and references (pdf), in which she gives an informal checklist for weak signals (quoted with minor changes to the English) that should be viewed as indicative of necessary rather than sufficient criteria:

  1. Makes your colleagues to laugh (ridicule)
  2. You colleagues are opposing it: no way, it will never happen
  3. Makes people wonder
  4. No one has heard about it before
  5. People would rather that no-one talks about it anymore (a tabu)

Two more Finns, Leena Ilmola and Anna Kotsalo-Mustonen discuss the importance of filters: “When monitoring their operating environments for weak signals and for other disruptive information companies face filters that hinder the entry of the information to the company”. Substitution of “technology enhanced learning community” for “company” gives us our initial problem statement.  Ilmola and Kotsalo-Mustonen describe thee kinds of filter following earlier work by Igor Ansoff, who is generally credited with introducing the concept of Weak Signals in the 1970’s:

  1. The surveillance filter. Colloquially, “just looking under the street-lamp”. The obvious compensator for the surveillance filter in our situation is diversity of recorded sources.
  2. The mentality filter. We tend to only notice things that are relevant to our immediate context and problems. Information overload and tendencies to conform to social norms and be influenced by fashion compound the effects of people working “in the trenches”. By using text mining approaches we hope to compensate for these problems by filtering information in the recorded sources in a mental-model-agnostic manner.
  3. The power filter. The signals of change that lead to change of strategy or action do so through an existing power structure and become filtered according to political considerations. Ideas that challenge the status quo are threatening. As for the previous filter, we hope to avoid some of the effect of the power filter, although not entirely. Most recorded sources have already been subjected to implicit (many bloggers self-censor to protect their job/career) or explicit (e.g. Journal or magazine articles) power filters.

The adoption of a text mining approach over a diverse range of recorded sources offers a promising means to draw out some Possible Weak Signals, although I am clear that text mining will be challenging to apply and that it will only be useful in tandem with human engagement. Given an initial list of possible signals, it will be necessary to apply some heuristics such as the Hiltunen checklist to try to reduce “noise”. These can then be used to facilitate discussion and disputation, cross-reference with other studies and with the conclusions of our “human sources” leading to ever shorter lists. If we find a few cases where people say “you know what, that isn’t so crazy after all”, or similar, I will consider the activity to have been a success. The next post summarises mainstream text mining approaches. describes how Weak Signals considerations affect the selection of text mining methods and outlines some ideas for application of text mining to look for possible weak signals.

eBooks in Education – Looking at Trends

eBooks seem to be appearing more frequently on trains and to be more talked of in educational settings but what are the trends behind these perceptions? One way of responding to this question is to use Google Trends or the “beta” Google Insights for Search. Clearly, this is only one perspective on a rather complex landscape of what people are doing in practice. I will describe some of the issues involved in using this data and the statistical tools I used (various features and contributed modules in the R “environment for statistical computing and graphics”) in a separate article. The essence of matter is that there are a whole series of biases, caveats and glossed-over statistical complexity.

Starting Out

After some tinkering with both Google Trends and Insights for Search, the facility of “Insights” to show trends filtered by categories encouraged me to opt for it rather than using “Trends” in spite of concerns about reliance on an unspecified categorisation mechanism.

The starting point is to access data for the search term “ebook” with worldwide coverage but filtered according to the “Education” category (a subcategory of “Society”). The time-based series looks like (this and all other images link to larger versions that open in a new window/tab):

Worldwide searches for "ebook" categorised as "Education"

Aside from some apparently-random fluctuation, there seems to be some pattern:

  • a slight decline between 2004 and early 2007
  • an exponential rise from early 2007
  • small steps up around year ends

Consulting the full Insights report (link above) shows two further points of interest:

  • India seems to be a hotspot. NB: Google has normalised the data so this means a greater fraction of Indian searches were for “ebook” compared to fractions in other countries.
  • “fac” and “ebook fac” appear to be “top searches” yet seem to be meaningless.

Digging Deeper – What is the meaning of “fac”?

Crossword enthusiasts may have already come to an intuitive conclusion which seems to be borne out by Googling for “fac”; these “top searches” look like typos for “facebook”.

So, we should modify the query to “Insights” to discount searches including “fac”, while retaining worldwide coverage and the Education filter. The resulting time-series looks like this (link to the full report):

Searches for "ebook" excluding "fac"

The broad trend and end-of-year seasonality seems to be still present but there seems to be more randomness and a few new features in 2009 and 2010. Having removed “fac” has also shown up some interesting new “top searches” in addition to the to-be-expected combination of “free”. “torrent” and “libre”: “toefl” and “gmat”.

Acronyms and abbreviations are often problematical to interpret as search terms but “toefl” and “gmat” have very clear meanings within an educational context.The first is the Test of English as a Foreign Language and the second is the Graduate Management Admissions Test. Both are associated with access to Higher Education and both are conducted using computer-based tests (although not exclusively). A separate investigation into trends related to these two terms might be interesting but has not been undertaken.

Decomposing “ebook -fac”: Trends, Seasonality and Transients

The time series for searches on “ebook” excluding “fac” was analysed using R (via the RKWard graphical interface). The broad question investigated was: what is the underlying smooth trend indicated by the data and what, if any, seasonal variation is there. Discrepancies between the trend +  seasonality and the data might be due to random variation or transients with a particular cause.

The “Seasonal Decomposition of Time Series by Loess” (Cleveland et al) was used after taking the logarithm of the count data. The outcome of this is:

STL Decomposition

(recall that I am omitting detail from this article; jumping straight to this set of graphs is to omit quite a lot)

A number of features are becoming more clear but note that the scales for each of the four plots differ and that these plots are for a decomposition after taking logarithms:

  • The data appears to be a lot more noisy. Whereas the previous plots as provided by Google are smoothed to give monthly values, the data acquired for analysis has a weekly level of granularity.
  • The overall trend is in line with an intuitive response to the previous plot. The decomposition indicates a flattening of interest during 2010. We should probably wait a little longer before making confident predictions that we are entering a plateau period.
  • The remainder, which is the difference between the data and the estimated (seasonal + trend), contains some extreme values in 2004 and 2005. The inability of the decomposition algorithm to handle these suggests that there was quite a lot of excitability about the topic of “ebook” among Google searchers which seems to have subsided during the strong upward trend. This suggests a solid foundation rather than hype in the latter period.
  • A seasonal pattern does appear to have been detected but it is of a similar magnitude to the remainder.

A closer look at the degree of fit is not so easy using the chosen decomposition method; more sophisticated methods would give a wider range of diagnostic measures. The chosen method does, however, include an iterative procedure where difficult-to-fit data points are given lower weightings. This gives us a slightly more robust means of assessing where transient (“excitable” behaviour) or aberrant data may be. The following plot has a somewhat arbitrary vertical scale and combines the count data (weekly) as a black line with red circles indicating a degree of “transience/aberrance”:

transience-aberranceRed circles on the baseline indicate datapoints with a weighting of 1 whereas those at the top were assigned a weighting of zero. This shows that the un-fittable data was indeed located within 2004 and 2005, the period of “excitability” proposed from considering the remainders. It also confirms that the rather peaky appearance during 2010 was fitted and is not a transient (NB that, since logs were taken the seasonal graph shows a multiplier to the trend not a simple addition when we revert to looking at the count data)

It is interesting to consider the Gartner Hype Cycle at this point as did my colleague, Stephen Powell. From the above trend line and the transience apparent above, it is tempting to suggest a slightly different way of looking at it than the Gartner plot. The trough of disillusionment through to the plateau of productivity can be imagined from 2006-2011. The “hype” in the ebook data is not so much a positive bulge but a period of “excitement”, of frequent but irregular transient peaks. From the point of view of analysts, pundits and know-it-all bloggers, this might have seemed like a peak of inflated expectations but aggregate normal people and the peak is largely suppressed.

A Closer Look at the Seasonal Pattern

The magnitude of the seasonality is more easily seen if converted back from the log scale and smoothed. A 5-week moving average gives the following plot, which shows a seasonal variation of around +25% and -20% from the trend. Since logs were taken, the seasonality is expressed as a multiplication factor rather than an absolute count fluctuation.

smoothed-seasonal-count2

Bearing in mind that this seasonality is of a similar magnitude to the “remainder”, one should be cautious in the absence of a plausible explanation. Recall that the data was filtered according to the “Educational” category. Maybe this pattern is reflective of a broader cycle of interest in matters educational rather than ebooks per se. Could this be related to term dates in educational establishments?

Fortunately, Google Insights for Search provides the trend at the level of the entire category. Take a look at the “Growth relative to the Education category” on the Insights report page.

If the total level of activity in the Education category is used as a factor to rescale each week’s data point and the resulting values then processed as above, the following decomposition emerges:

stldecomposition-rescaled

It is quite clear that the seasonality in the “ebook -fac” case cannot be explained away by background seasonal variation in the Education category as the magnitude of seasonal variation has in fact increased. The distribution of the remainder is also seen to be similar from inspection of quartiles and mean, although a detailed analysis was not undertaken (there are thought to be too many influences to make this valid). It seems to be the case that different seasonal patterns are at work in the category as a whole and the “ebook -fac” search term. Different regions are expected to have different seasonal patterns in general so it may be the case that the observed differences reflect regional variation.

Considering One Country – the UK

One of the weaknesses of Insights is that you must choose between worldwide or single-country specific data. It is not possible to choose a set of English-speaking countries, for example, or a set of European countries. The latter poses additional challenges around mapping language-specific terms to concepts, although in the present case, “ebook” is used in non-English speaking countries alongside native language equivalents.

Focussing on one country may make the seasonal component more easily interpreted. The same method was employed, except “ebook -fac” is taken as the starting point. Insights provides the following plot (and report):

UK Searches for "ebook" (excluding "fac"), filtered by Education category

Until Spring 2008, however, Google judges there to be an insufficient search volume to provide data for each week in spite of there being a line shown in the above plot from mid-2005. The reason for this discrepancy is unclear but the consequence is that the decomposition has a start date of April 6th 2008. Without going into the details, it is again found that rescaling by the background pattern in the Education category does not magically reveal insights. Hence the unscaled decomposition is considered:

stl-decomposition1

Having a shorter period to decompose means it is challenging to pick out seasonal patterns and the search volume is clearly more volatile than previously. Given the size of the remainder, it seems questionable to infer anything from the decomposed seasonality. Only two new  observations seem to remain:

  • there is no evidence for a plateau in the trend
  • there is a clear negative deviation around June/July 2010 indicated by a cluster of sequential negative remainders. This is also borne out when looking at the weightings (the “transience/aberrance” plot)

It is tempting to suggest that there is rather more “excitability” in the UK during 2008-present than in the worldwide picture. This is rather speculative but it is thought that a low search volume alone would not account for the noisiness. The mid-2010 negative deviation is a mystery; it would be easier to explain-away a positive transient. Maybe a repeat of the analysis in 6 months time will show that we have indeed plateaued and that the transient was actually a positive one in late 2010.

Conclusions

All of the above is contestable and I encourage disputation and alternative interpretation. In terms of interesting putative observations, my top 5 are:

  1. India is a relative hot-spot, coupled with TOEFL and GMAT appearing with “ebook”.
  2. There is a possible correlation with the Gartner Hype Cycle, albeit with a revised interpretation.
  3. A seasonal pattern in worldwide activity  remains unexplained.
  4. The UK seems to be “excitable” still.
  5. Typos have unexpected manifestations (“fac ebook”)

Finally, I’ve enjoyed dabbling with Google Insights for Search and learning quite a lot along the way, both about how to use Insights and about the handling and decomposition of time series data. I intend the next article will describe some of the “how I did it” using R.

ÜberStudent, Edubuntu – A sign of what is to come?

ÜberStudent is a new-comer (launched 2010) to the world of Linux distributions, being aimed at higher education and advanced secondary level students. Edubuntu has been around a few years longer. Both are based on the Ubuntu Linux distribution, which has a strong user-base among people who are not hard-core techies and who have migrated from Microsoft. A “distribution” is effectively a packaged-up combination of generic Linux code, drivers, applications etc.

As someone switched over to Ubuntu in October 2010, and with no regrets (I kept Windows 7 in reserve on the same machine but have never used it), I can imagine that ÜberStudent, or maybe a successor, maybe onto a winner. Consider some “what ifs”:

  • ubuntu makes headway with its offering for MIDs and netbooks and erodes the Android and iPhone territory
  • students look to save more money
  • students react against “the man” (after blithely paying for years) as part of a general reaction to the banking crisis and government policy
  • facebook, Apple or Google get too greedy or conceited.

I speculate that it is just a matter of time before “we” (staff in universities and colleges and their IT suppliers etc) need to grapple with a new wave of issues around user-owned technologies. How well would we cope if everyone accessed the VLE and portal (Sharepoint?) with Firefox and accessed powerpoint presentations or submitted documents/spreadsheets using LibreOffice? How much worse does this look when they are paying £6000-£9000 per annum?

Before ending, I should say that ubuntu is not all bliss – getting modern operating systems to work across diverse hardware and configurations is seriously difficult – but overall, it has been a good move for me. I just want a computer I can use for work, mostly email, calendar, documents, web…

So, what do I like about the change? NB these are a mix of features of the technical aspects of Linux/Ubuntu and consequences of the Open Source model. In brief:

  • Less friction – there are fewer times when I have to sit, waiting for something to happen.
  • Less conceitedness – I really dislike the way MS Windows tries to control the way you do things. This has got worse over the years. It seems you have to brainwash yourself to the Windows Way to avoid temptation to profanity.
  • More freedom – no-one is trying to “monetise” things. No I don’t want to change my search engine, use a particular cloud-based application, get my games from XXX. This is one of the things that stops me going Android.
  • Less memory use – less than 1Gb is more than adequate whereas my XP used to just swallow it up
  • More disciplined software management – if you stick to using the Package Manager

And what don’t I like? Only that the video driver often crashes if I change to using a monitor rather than the laptop screen. In general, hardware is a source of niggles and battery consumption is not so well optimised as for Windows or MacOS (Apple is especially good at this as they control the hardware and operating system).

In conclusion:

  • I recommend you try ubuntu; it can be tried by running off CD or a USB stick without “nuking” your current system or try installing on a PC that has just been retired (NB if you try a machine much older than 5 years the hardware driver support may cause problems)
  • Watch out for the future!