The death of Free2Play is a good thing beyond the games industry

Way back in February the EU commission raised concerns over business models in the mobile phone ‘app industry’. There were 4 major points of concern, these are taken directly from the EC press release :

• Games advertised as “free” should not mislead consumers about the true costs involved;
• Games should not contain direct exhortations to children to buy items in a game or to persuade an adult to buy items for them;
• Consumers should be adequately informed about the payment arrangements and purchases should not be debited through default settings without consumers’ explicit consent;
• Traders should provide an email address so that consumers can contact them in case of queries or complaints.

Two weeks ago a follow up release gave details of changes to the Google Play store that will take place before the end of September:

What is Learning Analytics?

Our research department is currently housing a student from a different institution who is interested in mobile learning. She has just finished her doctorate in a Spanish university and is about to head home to China. During a welcome meeting our guest proclaimed an interested in mobile learning and Learning Qnalytics. One of our departments professors then singled me out, “David knows all about Learning Analytics”.

I really should know about Learning Analytics. I’m currently involved in a EU project with the term Learning Analytics in the title. I helped write a paper on tools for learning analytics and have read many papers coming out of our department on it.

The student looked at me, raised an eyebrow. I waved my hand, said that we can catch up later, worried that I still don’t haven’t a clue about Learning Analytics. I just don’t have an answer to the question: ‘what is Learning Analytics?’. I can’t claim that data informed decision-making is a new thing, I don’t suppose it’s even new in the context of applying it to education. Also, how does it differ to educational data mining? I’ve never really understood that; I read somewhere that education data mining included academic analytics in it’s scope, I guess because academics aren’t learning anything they can’t be included in learning analytics, who knows.

The trouble is that when it comes to Learning Analytics I don’t think there is a good snappy sound bite on learning analytics to spurt out when your professor drops you in it at the meeting. Fortunately there a list of 5 things in a Cetis briefing paper by my colleagues that I always return too whenever I am lost in learning analytics. These 5 areas of learning analytics are

Cetis Conference 2014 – fringe activities

Registration has now opened on the Cetis site for the CETIS 2014 conference. From the Cetis site:

Each year the Cetis conference provides a unique opportunity for developers, learning technologists, lectures and policy makers to come together to discuss recent innovations in the domain of education technology. This year’s conference focuses on the digital institution and explores how technology innovation can support and develop every aspect of university and college life, for teachers and learners, researchers and developers, service directors and senior managers.

Generally  the Cetis conference is a great place to meet people doing similar things and have a natter about the important stuff.  This year the conference takes place on the 17th and 18th of June and  is being held Bolton and since you’ll be coming to Bolton you might as well make the most of your time here to explore ‘Britain’s Friendliest Town’.

  • Sports fans will need to check out Bolton’s Robots of Doom baseball team, who hit fame when they were voted as having the second most interesting name by Major League Baseball Magazine and featured in a two page article in Lancashire Life magazine.
  • History fanatics and beer drinkers will want to check out the ye olde man and scythe which is  one of the the 10 oldest pubs in Britain. The 7th Earl of  Derby was executed here during the civil war, his ghost has appeared in the book Bolton’s most haunted and plenty of YouTube videos
  • Gourmands will enjoy the ye old pasty shoppe which appeared in  ITV’s smash show, Britain’s Best Bakery.
  • Shoppers are catered for as Bolton has three Morrisons
  • Autograph hunters often spot Peter Kay’s Mum

Even if you don’t get time to explore the joys of Bolton, you should still come to the conference:

The post Cetis Conference 2014 appeared first on Paddy the Rabbit.

Topic Models to explore and compare communities

Recently I’ve been playing with an R wrapper for a machine language library called Mallet  to generate lists of topics from a series of text documents. The technique is called Topic Modelling and I have gotten to grips with it from Ben Marwick‘s readings of archaeology papers which has some excellent reusable code.  A topic in my model is simply a collection of words that make up the topic. Mallet can do all sorts of fancy things with the words and topics, it can tell me how likely a word is to appear in the topic, analyse text and tell me how much of that text belongs to which topics.

Innovation in the eighth generation

According to Wikipedia there are eight generations of video game consoles, each generation defined by the consoles that are released and the innovations they make. We are at the start of the eighth generation with the PS4 and  Xbox one about to hit the shelves this month.

Releasing a console is such big business that the money made from the console purchase itself is negligible. Often sold at a loss console developers will instead be hoping to cash in on much more, including licensing fees, monthly subscriptions, video steaming rental and advertising.

I finished a MOOC!

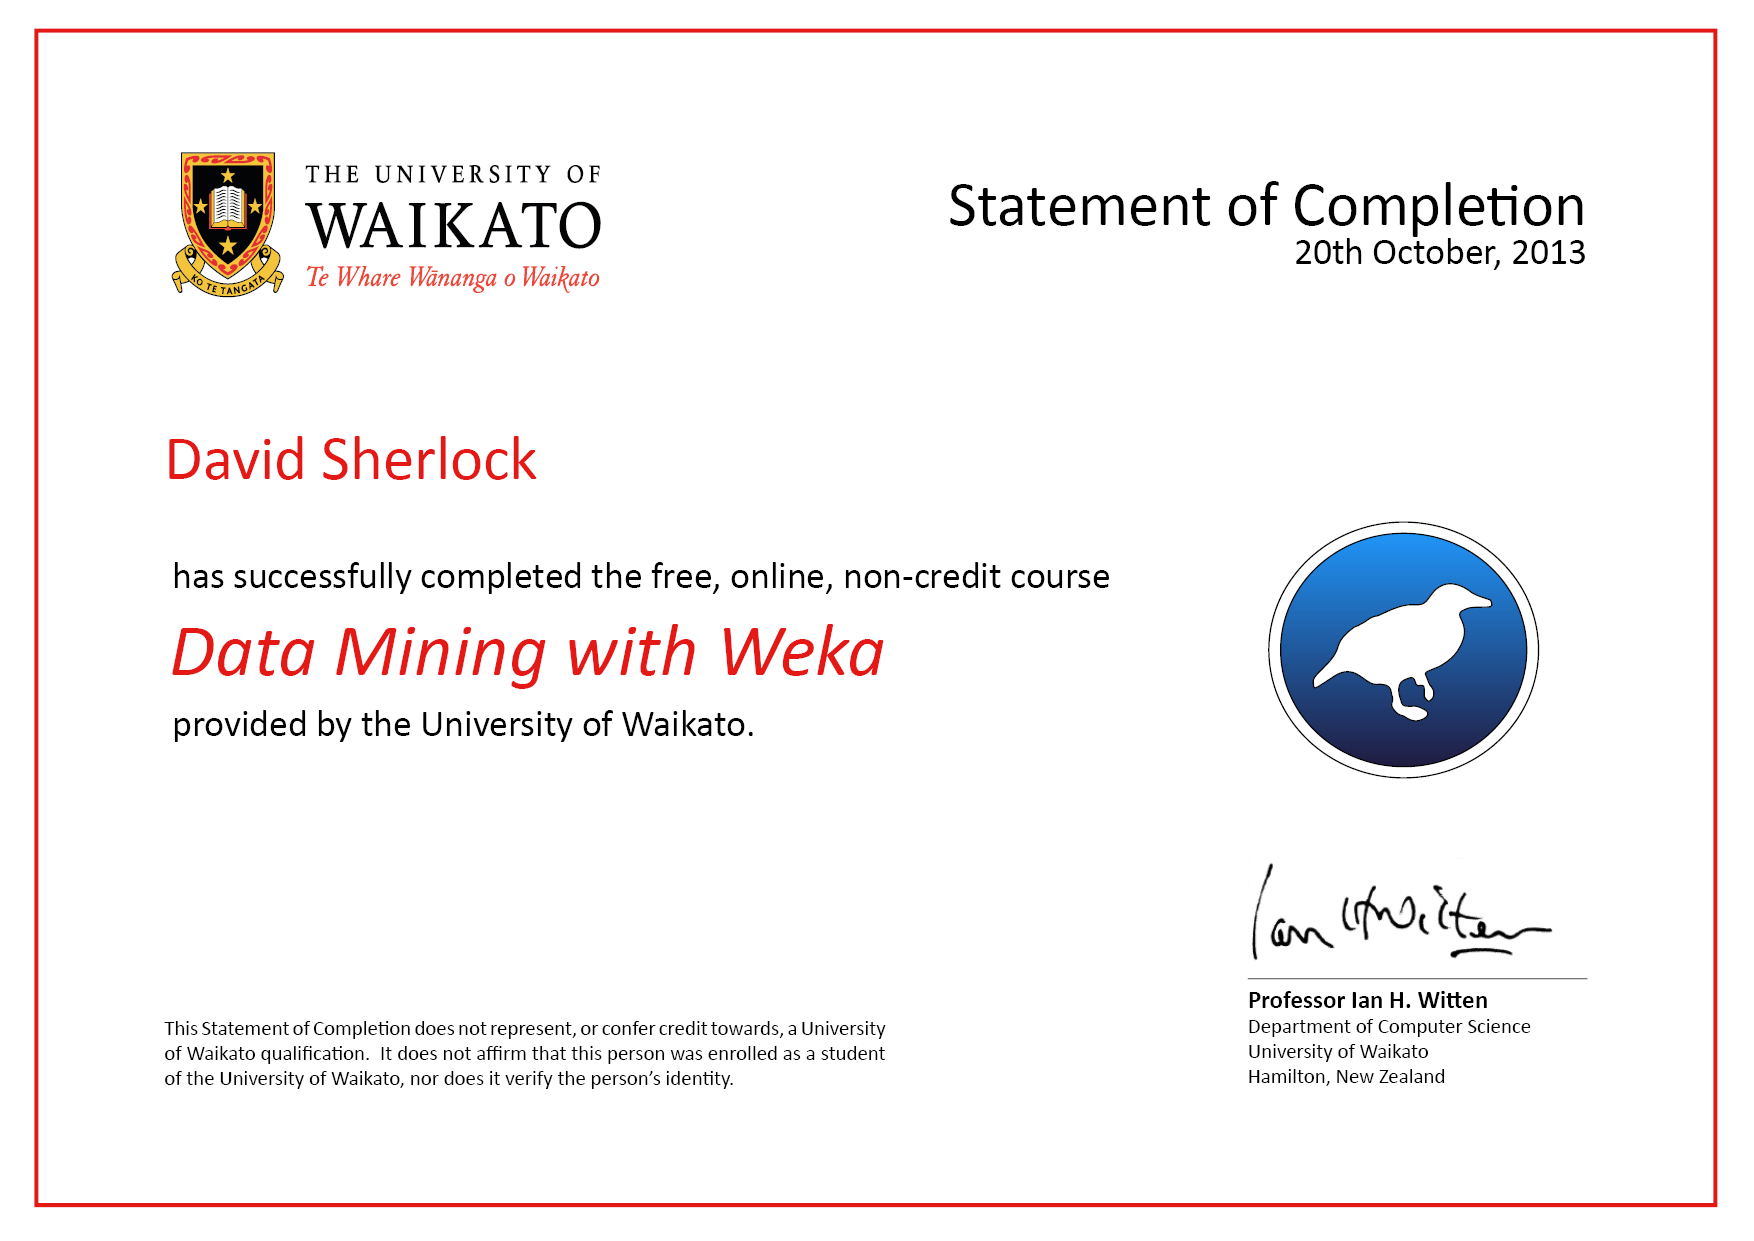
I’m feeling really chuffed with myself, I got to the end of a MOOC.

mooc-certificate-production222

So what did I learn from the experience? If you haven’t already guessed I picked up a little bit about Weka.  Still, I don’t  feel much like a Weka expert, I’m not even sure I can remember where all the buttons are. What was more important for me was getting involved in learning new stuff with people who are outside of my usual work circle.

An interactive employability event, some notes

Last week at the University of Bolton we put on a workshop for final year students that were about to embark on a job hunt. While the workshop was held in conjunction with the careers advice service and there was chance to give students a hand with practical things such as CV writing and interview technique we also wanted to get the students to talk to one another, reflect and share experiences from their time at the University to boost their confidence and help each other identify things such as transferable skills and job hunting tips.

graph

Graph Widget example and the lone psychology job hunter (click to enlarge)

Before the event I built some bits of software with the aim to provide Sheila and Stephens first possibility of Learning Analytics. That is the possibility that learning analytics could allow ‘individual learners to reflect on their achievements and patterns of behaviour in relation to others’. The software was quite simple, there were two sets of widgets, one set of widgets was designed to collect information from the students. This set of widgets was mode up simple text forms of checkboxes that the students could access on their laptops/phones/ipads. Questions where asked in a variety of ways, sometimes the widget itself would prompt the student with a question and waited for an answer (what the questions were and when they where asked were controlled by staff) and sometimes they were simply asked to input answers/thoughts/feelings during various stages of an activity (involving an activity with play doh!).

tree

Example Tree Widget, at this stage most students claimed they weren't on the job hunt.. (Click to enlarge)

The other set was designed to show the students how their experiences related to those of other students by a series of d3.js powered visualisations. Each of these widgets had a single visualisation on and a collection if them where shown on a dashboard at the front of the workshop hall and were updated in real time, so that if a student added a response to an input widget they could instantly see how it fit in to the big picture. Students also had the ability to take away single visualisations and interact with them on their own devices.

sanky

If I said X am I likely to say Y

We had approached the event with quite a ‘handwavy’ idea, we weren’t sure if the visualisations or data would mean anything to the students, my colleague was writing bits of code 5 minutes before the event and at one point I had to add some data sanitization during one of the exercises, to keep the widgets alive. Still, the students seemed to really like real time feedback from the analytics. Students regularly checked the dashboard waiting for their answers to pop up on the screen to see who gave similar answers and where their answers sat in the grand scheme of things. Most importantly it got them talking to each other, the input widgets gave them the ability to go back and change answers and there were some tactical changes between groups of students to improve what their future picture looked like.

My todo list:

  • Fix Widgets, get a working demo!
  • The widgets are in a sorry state with lots of bubblegum code and hacks sticking bits together. Better sort them out and get a working demo up!

  • Work on ways to share the activity (via OMDL)
  • Lots of students (particularly psychology students!) liked the real time dashboard of answers and wondered if they could implement it themselves for their own events. This isn’t a problem if the widgets are to go in Moodle or Apache Rave then this wouldn’t be a problem since we can use ODML, essentially a MarkUp language that defines widgets and their layout so they can be moved from one platform to another.

  • Try to capture more data next time
  • Feeding the data back to the students was interesting but I wonder what we can learn about our event from it? Something I didn’t collect but would be interested in was the points of the event where the students decided to change their data. I wonder what it was that made them change their answer from ‘not currently looking for a job’ to ‘desperately applying for everything’.

Analytics Tools and Infrastructure Briefing Paper

I volenteered to help write a briefing paper on analytic tools in the hope of stealing some time to play with cool stuff. The joy of having some play time in work quickly evaporated when it struck me that not only is there a very large number of tools but also that they come from communities of such diverse practices. It was quickly evident that creating a full list of tools would be impossible and almost certainly out of date the moment it was released.

As such, Wilbert and I have opted to provide a map of communities with information on landmark tools hoping to guide the you to a community, tool, or set of tools that fits your needs.

The briefing paper “Analytics Tools and Infrastructure” has just been released and is tenth in the CETIS Analytics Series.

Our favourite posts of 2012

Those who subscribe to the CETIS newsletter will receive the top posts of the month ranked by the total number of views they’ve had, while its nice to see what our audience find interesting sometimes we have our own personal favourites that we’d like to share. I asked CETIS staff if they wanted to share any of blog posts they had written in 2012 they were fond of and why..

Sharon:
My favourite post of 2012 is “The MOOC just got even better“, which mentions some of my reflections on taking Stanford’s HCI MOOC over the autumn semester. There has been a lot of MOOC-bashing lately and whilst they’re not perfect (in fact Coursera has only been around for a year), from a student’s point of view they’re a great way to access free education from reputable institutions. Sometimes I think we’re so busy looking at the technology or the process, that we forget about the student. To be involved in something at the beginning that will undoubtedly mature and change is exciting and I look forward to seeing how MOOCs will evolve.

Simon:
For this year, I choose not a post that has received comments, but one that has not, Follower guidance idea.

I had first used the term “follower guidance” in a CETIS e-mail in May 2011, so it had brewed in my mind for over a year before this exposition. I think we (in CETIS/IEC) should be doing this kind of exposition of vision, whether or not it is immediately recognised or responded to. In this case, I have to accept that people have not yet digested the idea enough to comment on it, though when I explain it face-to-face it seems to be understood and appreciated at some level. So I offer this post as a hope for the future — maybe it will be referred to by others as the ideas come to make more sense.

Sheila:
First one is “a conversation around what it means to be a digital university“.  This was a personal favourite as it was more of a staff development activity for me as it allowed me to co-author some thoughts with my Strathclyde Uni colleague Bill Johnston around strategic aspects of becoming a digital university. We’ve had very positive feedback, conference presentation and a couple of papers in the pipeline from this. We’ve also been approached by Napier University to be critical friends over the next year as they develop their digital strategy.

The second one, is one of those posts that I kind of wrote off the cuff and is “learning analytics, where do you stand?“. It was really useful to reflect on a presentation from Gardner Campbell about learning analytics, and I got quite a few comments, which is always good. The post  also helped to set the scene for our work on analytics this year which culminating in the CETIS Analytics Series.

Martin
Notes on technology behind cMOOCs: Show me your aggregation architecture and I’ll show you mine
This post started as a simple analysis of the infrastructure around MOOCs, but as a wrestled with the text a couple of revelations emerged.
Focusing on the connectivist style of courses it’s evident that instructors are picking up the tools around them to manage courses. Because, as Downes commented, ‘users are assumed to be outside the system for the most part, inhabiting their own spaces’ aggregation of data becomes key. Even when you deal with well-established technologies like blogs there are interoperability issues with extracting data like category/tags and user comments. One of the key challenges in moving connectivist style MOOCs forward is developing tools that can effectively aggregate data from a range of sources and provide actionable insights for both tutors and students. This post highlights some current work and possible future directions.

Do you git it?: Open educational resources/practices meets software version control
Software version control tools like Git have long provided software developers a space to collaboratively work on projects providing an easy way track, contribute and modify code even when offline. Given the features of remixing and branch existing material you’d think it would make the ideal repository for open educational resources (OER). This solution is not without its issues such as confusing terminology and very structured workflows but it’s interesting to see non-coders adopt Git as a place to host their content. This post highlights some existing examples like open bid writing, music and course content and asks should we be Gitting OER.

Phil
At the end of the JLeRN experiment

Not so much because of what is in the blog post but because of the work it represents which illustrates how CETIS can spot an innovation that looks interesting and work with Jisc and Jisc services to trial it in a UK F&HE context.

Lorna:

Since Phil has already chosen his JLeRN Experiment blog post, I’m going to choose this: OER Booksprints Reflections

I’ve chosen this as post as undertaking a booksprint to synthesise, record and disseminate the technical outputs and issues surfaced by Jisc programmes was an entirely new approach for both Jisc and CETIS.   A booksprint is essentially an accelerated facilitated writing retreat and our aim was to draw together the significant technical outputs of three years of the JISC / HEA Open Educational Resources Programmes, reflect on issues that arose and identify future directions.  I think its fair to say that we all approached the task with some trepidation and perhaps even a little scepticism but we were all greatly surprised and encouraged by the result: “Technology for open educational resources – Into the  Wild”,  which will be available to download as a free ebook, or to print on demand in the new year.  On reflection, we all agreed that this was a very effective way to synthesise the complex outputs of the programmes and I would certainly recommend this approach to others.  And who knows, we might even plan another sprint in the new year!
Posted in Uncategorized