An interactive employability event, some notes

Last week at the University of Bolton we put on a workshop for final year students that were about to embark on a job hunt. While the workshop was held in conjunction with the careers advice service and there was chance to give students a hand with practical things such as CV writing and interview technique we also wanted to get the students to talk to one another, reflect and share experiences from their time at the University to boost their confidence and help each other identify things such as transferable skills and job hunting tips.

graph

Graph Widget example and the lone psychology job hunter (click to enlarge)

Before the event I built some bits of software with the aim to provide Sheila and Stephens first possibility of Learning Analytics. That is the possibility that learning analytics could allow ‘individual learners to reflect on their achievements and patterns of behaviour in relation to others’. The software was quite simple, there were two sets of widgets, one set of widgets was designed to collect information from the students. This set of widgets was mode up simple text forms of checkboxes that the students could access on their laptops/phones/ipads. Questions where asked in a variety of ways, sometimes the widget itself would prompt the student with a question and waited for an answer (what the questions were and when they where asked were controlled by staff) and sometimes they were simply asked to input answers/thoughts/feelings during various stages of an activity (involving an activity with play doh!).

tree

Example Tree Widget, at this stage most students claimed they weren't on the job hunt.. (Click to enlarge)

The other set was designed to show the students how their experiences related to those of other students by a series of d3.js powered visualisations. Each of these widgets had a single visualisation on and a collection if them where shown on a dashboard at the front of the workshop hall and were updated in real time, so that if a student added a response to an input widget they could instantly see how it fit in to the big picture. Students also had the ability to take away single visualisations and interact with them on their own devices.

sanky

If I said X am I likely to say Y

We had approached the event with quite a ‘handwavy’ idea, we weren’t sure if the visualisations or data would mean anything to the students, my colleague was writing bits of code 5 minutes before the event and at one point I had to add some data sanitization during one of the exercises, to keep the widgets alive. Still, the students seemed to really like real time feedback from the analytics. Students regularly checked the dashboard waiting for their answers to pop up on the screen to see who gave similar answers and where their answers sat in the grand scheme of things. Most importantly it got them talking to each other, the input widgets gave them the ability to go back and change answers and there were some tactical changes between groups of students to improve what their future picture looked like.

My todo list:

  • Fix Widgets, get a working demo!
  • The widgets are in a sorry state with lots of bubblegum code and hacks sticking bits together. Better sort them out and get a working demo up!

  • Work on ways to share the activity (via OMDL)
  • Lots of students (particularly psychology students!) liked the real time dashboard of answers and wondered if they could implement it themselves for their own events. This isn’t a problem if the widgets are to go in Moodle or Apache Rave then this wouldn’t be a problem since we can use ODML, essentially a MarkUp language that defines widgets and their layout so they can be moved from one platform to another.

  • Try to capture more data next time
  • Feeding the data back to the students was interesting but I wonder what we can learn about our event from it? Something I didn’t collect but would be interested in was the points of the event where the students decided to change their data. I wonder what it was that made them change their answer from ‘not currently looking for a job’ to ‘desperately applying for everything’.
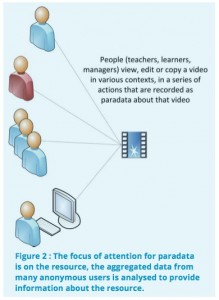
IT departments – the institutional fall guy for MOOCs?

The Fall Guy

The Fall Guy


(Image from IMDB http://www.imdb.com/media/rm782014464/tt0081859)

As Martin Weller pointed out earlier this week there are a growing number of MOOC metaphors being created. As I’ve been following the tweets from today’s “#moocapalooza ” (a hashtag I think invented by David Kernohan) a.k.a. Open and Online Learning making the most of MOOCs and other Models Conference I think I need to to add the Fall Guy to Martin’s list, particularly after reading this tweet.

I’m going to try and not too much in this post, and I apologise for taking this tweet at face value and out with its original context, but . . . Isn’t this just another one of those MOOC myths that twist the reality of what happens within institutions to suit the “education is broken we must build something else” mind set? As Martin Hawskey and Lorna Campbell both said in response to David’s tweet it’s not the systems that are the problem.

I’m going to stick my neck out (not too far) and say every technology you need to run a MOOC is available within every University. I’ve not seen anything in my adventures in MOOC-land that has made me think “oh wow, wish we could have one of those back in the non-MOOC world”. There are VLEs, blogs, wikis aplenty. And IT departments do a sterling job in keeping these running for all that “non MOOC stuff” that Universities do. You know, the dull and boring things you need to do “traditional” teaching.

Yesterday during a webinar on analytics and assessment and feedback, Rachel Forsyth (MMU) shared some of their learning system analytics data. Since the beginning of this year they’ve had over 8 million hits on their mobile interface which allows students to access key information like assessment marks, timetables and reading lists. At key points of in the year they have over 100,000 assignments being submitted electronically. I suspect many institutions are working at this scale. So I don’t think it’s a question of IT department’s not being up to delivering MOOCs, I think it’s more that they have quite a lot to do already and adding another potentially x000,000 of users is not something that can be undertaken lightly, or without any cost implications.

Investing in internal IT resources isn’t seen as a key part of MOOC development strategy. Why would it be when Coursera etc have been able to get money to build systems. In many ways using an external platform like FutureLearn is a very sensible option. It means that experiments with MOOCs can take place without putting additional strain on existing resources. We all know, or should do by now, that there’s no such thing as a free MOOC and that includes the infrastructure they sit within. So let’s not let another myth develop that the HE sector don’t have the technology or the ability to deliver MOOCs. They do, it’s just that it’s already working at capacity delivering their day to day business.

Analytics in UK Further and Higher Education Survey

Over the past few months, we at Cetis have been involved in a number of analytics related activities, most notably our Analytics Series of papers and case studies. Although we know there are pockets of really exciting developments here in the UK, we are keen to find out more about what is actually happening in our Universities and Colleges. In order to give us (and the community) a more accurate insight we are launching our Analytics in UK Further and Higher Education survey. From teaching and learning to the library to registry and business intelligence, we need to hear from you!

The survey is quite short (12 questions) and has been designed to try and allow us to undertake a “lite” benchmark of activity in the UK sector. We’d really appreciate if you could take 10 minutes or so to give us your feedback. The survey will stay open until June 16. Once we have all the data we will of course publish the results. We will be sharing our initial analysis of the data at a session at this years ALT-C.

The survey can be accessed here, please feel free to pass the link on to any relevant colleagues.

Learning Analytics for Assessment and Feedback Webinar, 15 May

**update 16 May**
Link to session recording

Later this week I’ll be chairing a (free) webinar on Learning Analytics for Assessment and Feeback. Featuring work from three projects in the current Jisc Assessment and Feedback Programme. I’m really looking forward to hearing first hand about the different approaches being developed across the programme.

“The concept of learning analytics is gaining traction in education as an approach to using learner data to gain insights into different trends and patterns but also to inform timely and appropriate support interventions. This webinar will explore a number of different approaches to integrating learning analytics into the context of assessment and feedback design; from overall assessment patterns and VLE usage in an institution, to creating student facing workshops, to developing principles for dashboards.”

The presentations will feature current thinking and approaches from teams from the following projects:
*TRAFFIC, Manchester Metropolitan University
*EBEAM, University of Huddersfield,
*iTeam, University of Hertfordshire

The webinar takes place Wednesday 15 May at 1pm (UK time) and is free to attend. A recording will also be available after the session. You can register by following this link.

Learning Analytics Interoperability

The ease with which data can be transferred without loss of meaning from a store to an analytical tool – whether this tool is in the hands of a data scientist, a learning science researcher, a teacher, or a learner – and the ability of these users to select and apply a range of tools to data in formal and informal learning platforms are important factors in making learning analytics and educational data mining efficient and effective processes.

I have recently written a report that describes, in summary form, the findings of a survey into: a) the current state of awareness of, and research or development into, this problem of seamless data exchange between multiple software systems, and b) standards and pre-standardisation work that are candidates for use or experimentation. The coverage is, intentionally, fairly superficial but there are abundant references.

The paper is available in three formats: Open Office, PDF, MS Word. If printing, note that the layout is “letter” rather than A4.

Comments are very welcome since I intend to release an improved version in due course.

Analytics Tools and Infrastructure Briefing Paper

I volenteered to help write a briefing paper on analytic tools in the hope of stealing some time to play with cool stuff. The joy of having some play time in work quickly evaporated when it struck me that not only is there a very large number of tools but also that they come from communities of such diverse practices. It was quickly evident that creating a full list of tools would be impossible and almost certainly out of date the moment it was released.

As such, Wilbert and I have opted to provide a map of communities with information on landmark tools hoping to guide the you to a community, tool, or set of tools that fits your needs.

The briefing paper “Analytics Tools and Infrastructure” has just been released and is tenth in the CETIS Analytics Series.

Analytics is Not New!

As we collectively climb up the hype cycle towards the peak of inflated expectations for analytics, and I think this can be argued for many industries and applications of analytics, a bit of historical perspective makes a good antidote both to exaggerated claims but also to the pessimists who would say it is “all just hype”.

That was my starting point for a  paper I wrote towards the end of 2012 and which is now published as “A Brief History of Analytics“. As I did the desk research, three aspects recurred:

  1. much that appears recent can be traced back for decades;
  2. the techniques being employed by different communities of specialists are rather complementary;
  3. there is much that is not under the narrow spotlight of marketing hype and hyperbole.

The historical perspective gives us inspiration in the form of Florence Nightingale‘s pioneering work on using statistics and visualisation to address problems of health and sanitation and to make the case for change. It also reminds us that Operational Researchers (Operations Researchers) have been dealing with complex optimisation problems including taking account of human factors for decades.

I found that writing the paper helped me to clarify my thinking about what is feasible and plausible and what the likely kinds of success stories for analytics will be in the medium term. Most important, I think, is that our collective heritage of techniques for data analysis, visualisation and use to inform practical action shows that the future of analytics is a great deal richer than the next incarnation of Business Intelligence software or the application of predictive methods to Big Data. These have their place but there is more; analytics has many themes that combine to make it an interesting story that unfolds before us.

The paper “A Brief History of Analytics” is the ninth in the CETIS Analytics Series.

A Seasonal Sociogram for Learning Analytics Research

SoLAR, the Society for Learning Analytics Research has recently made available a dataset covering research publications in learning analytics and educational data mining and issued the LAK Data Challenge, challenging the community to use the dataset to answer the question:

What do analytics on learning analytics tell us? How can we make sense of this emerging field’s historical roots, current state, and future trends, based on how its members report and debate their research?

Thanks to too many repeats on the TV schedule I managed to re-learn a bit of novice-level SPARQL and manipulate the RDF/XML provided into a form I can handle with R.

Now, I’ve had a bit of a pop at the sociograms – i.e. visualisations of social networks – in the past but they do have their uses and one of these is getting a feel for the shape of a dataset that deals with relations. In the case of the LAK challenge dataset, the relationship between authors and papers is such a case. So as part of thinking about whether I’m up for the approaching the challenge from this perspective it makes sense to visualise the data.

And with it being the Christmas season, the colour scheme chose itself.

Bipartite Sociogram for Paper Authorship for Proceedings from LAK, EDM and the JETS Special Edition on Learning Analytics

Paper Authorship for Proceedings from LAK, EDM and the JETS Special Edition on Learning and Knowledge Analytics (click on image for full-size version)

This is technically a “bipartite sociogram” since it shows two kinds of entity and relationships between types. In this case people are shown as green circles and papers shown as red polygons. The data has been limited to the conferences on Learning Analytics and Knowledge (LAK) 2011 and 2012 (red triangles) and the Educational Data Mining (EDM) Conference for the same years (red diamonds). The Journal of Educational Technology and Society special edition on learning and knowledge analytics was also published in 2012 (red pentagons). Thus, we have a snapshot of the main venues for scholarship vicinal to learning analytics.

So, what does it tell me?

My first observation is that there are a lot of papers that have been written by people who have written no others in the dataset for 2011/12(from now on, please assume I always mean this subset). I see this as being consistent with this being an emergent field of research. It is also clear that JETS attracted papers from people who were not already active in the field. This is not the entire story, however as the more connected central region of the diagram shows. Judging this region by eye and comparing it to the rest of the diagram, it looks like there is a tendency for LAK papers (triangles) to be under-represented in the more-connected region compared to EDM (diamonds). This is consistent with EDM conferences having been run since 2008 and their emergence from workshops on the Artificial Intelligence in Education. LAK, on the other hand began in 2011. Some proper statistics are needed to confirm judgement by eye. It would be interesting to look for signs of evolution following the 2013 season.

A lot of papers were written by people who wrote no others.

A lot of papers were written by people who wrote no others.

The sign of an established research group is the research group head who co-authors several papers with each paper having some less prolific co-authors who are working for the PhDs. The chief and Indians pattern. A careful inspection of the central region shows this pattern as well as groups with less evidence of hierarchy.

Cheif and Indians.

Chief and Indians.

A less hierarchical group.

A less hierarchical group.

LAK came into being and attracted people without a great deal of knowledge of the prior existence of the EDM conference and community so some polarisation is to be expected. There clearly are people, even those with many publications, the have only published to one venue. Consistent with previous comments about the longer history of EDM it isn’t surprising that this is most clear for that venue since there are clearly established groups at work. What I think will be some comfort to the researchers in both camps who have made efforts to build bridges is that there are signs of integration (see the Chiefs and Indians snippet). Whether this is a sign of integrating communities or a consequence of individual preference alone is an open question. Another question to consider with more rigour and something to look out for in the 2013 season.

Am I any the wiser? Well… slightly, and it didn’t take long. There are certainly some questions that could be answered with further analysis and there are a few attributes not taken account of here, such as institutional affiliation or country/region. I will certainly have a go at using the techniques I outlined in a previous post if the weather is poor over the Christmas break but I think I will have to wait until the data for 2013 is available before some of the interesting evolutionary shape of EDM and LAK becomes accessible.

Merry Christmas!

Looking Inside the Box of Analytics and Business Intelligence Applications

To take technology and social process at face value is to risk failing to appreciate what they mean, do, and can do. Analytics and business intelligence applications or projects, in common with all technology supported innovations, are more likely to be successful if both technology and social spheres are better understood. I don’t mean to say that there is no room for intuition in such cases, rather that it is helpful to decide which aspects are best served by intuition or not and by whose intuition, if so. But how to do this?

Just looking can be a poor guide to understanding an existing application and just designing can be a poor approach to creating a new one. Some kind of method, some principles, some prompts or stimulus questions – I will use “framework” as an umbrella term – can all help to avoid a host of errors. Replication of existing approaches that may be obsolete or erroneous, falling into value or cognitive traps, failure to consider a wider range of possibilities, etc are errors we should try to avoid. There are, of course, many approaches to dealing with this problem other than a framework. Peer review and participative design have a clear role to play when adopting or implementing analytics and business intelligence but a framework can play a part alongside these social approaches as well as being useful to an individual sense-maker.

The culmination of my thinking about this kind of framework has just been published as the seventh paper in the CETIS Analytics Series, entitled “A Framework of Characteristics for Analytics“. This started out as a personal attempt to make sense of my own intuitive dissatisfaction with the traditions of business intelligence combined with concern that my discussions with colleagues about analytics were sometimes deeply at cross purposes or just unproductive because our mental models lacked sufficient detail and clarity to properly know what we were talking about or to really understand where our differences lay.

The following quotes from the paper.

A Framework of Characteristics for Analytics considers one way to explore similarities, differences, strengths, weaknesses, opportunities, etc of actual or proposed applications of analytics. It is a framework for asking questions about the high level decisions embedded within a given application of analytics and assessing the match to real world concerns. The Framework of Characteristics is not a technical framework.

This is not an introduction to analytics; rather it is aimed at strategists and innovators in post-compulsory education sector who have appreciated the potential for analytics in their organisation and who are considering commissioning or procuring an analytics service or system that is fit for their own context.

The framework is conceived for two kinds of use:

  1. Exploring the underlying features and generally-implicit assumptions in existing applications of analytics. In this case, the aim might be to better comprehend the state of the art in analytics and the relevance of analytics methods from other industries, or to inspect candidates for procurement with greater rigour.
  2. Considering how to make the transition from a desire to target an issue in a more analytical way to a high level description of a pilot to reach the target. In this case, the framework provides a starting-point template for the production of a design rationale in an analytics project, whether in-house or commissioned. Alternatively it might lead to a conclusion that significant problems might arise in targeting the issue with analytics.

In both of these cases, the framework is an aid to clarify or expose assumptions and so to help its user challenge or confirm them.

I look forward to any comments that might help to improve the framework.