What technology is being used to aggregate open educational resources? What role can the subject community play in resources discovery? This is a post in the UKOER 2 technical synthesis series.
[These posts should be regarded as drafts for comment until I remove this note]
In the UKOER 2 programme Strand C funded “Projects identifying, collecting and promoting collections of OER and other material around a common theme” with the aim “…to investigate how thematic and subject area presentation of OER material can make resources more discoverable by those working in these areas” (UKOER 2 call document). The projects had to create what were termed static and dynamic collections of OER. The intent of the static collection was that it could in some way act as an identity, focus, or seed for the dynamic collection. Six projects were funded: CSAP OER, Oerbital, DelOREs, Triton, EALCFO, Open Fieldwork and a range of approaches and technologies was taken to making both static and dynamic collections. The projects are all worth reading about in more detail – however, in this context there are two possible general patterns worth considering.
Technology
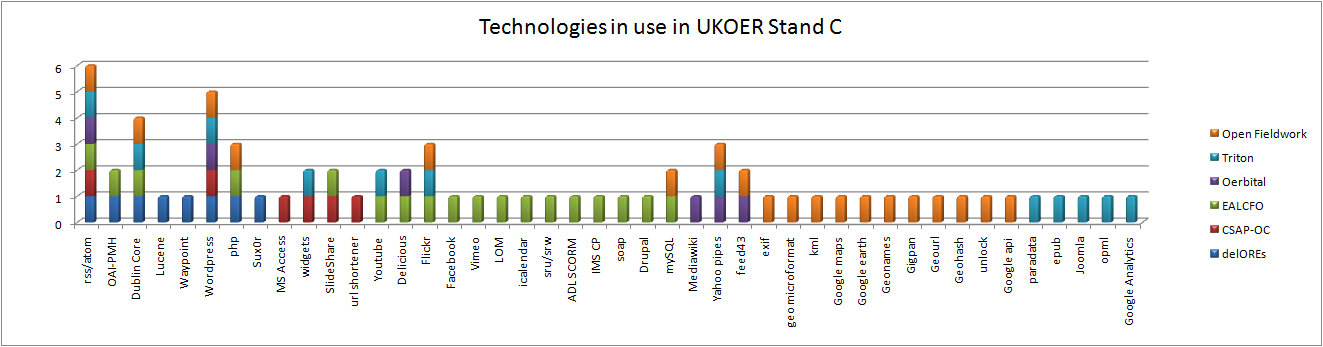
Overview of technical choices in UKOER 2 Strand C
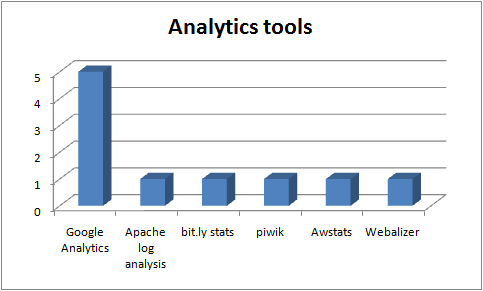
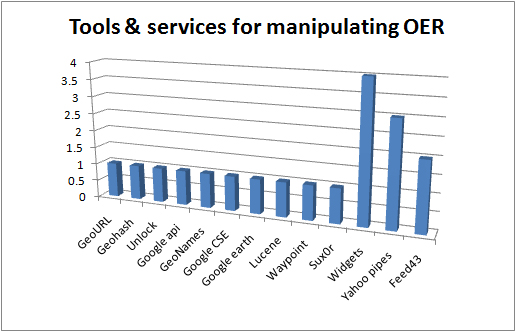
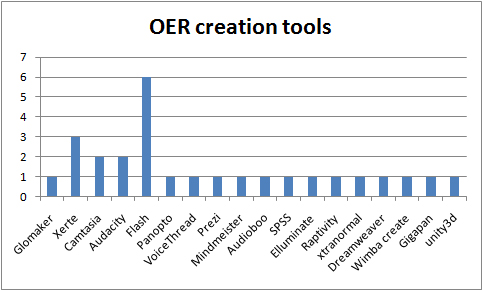
The above graph shows the range of technology used in the Strand. Although a lot could (and should) be said about each project individually when their choices are viewed in aggregate the following technologies are seeing the widest use.
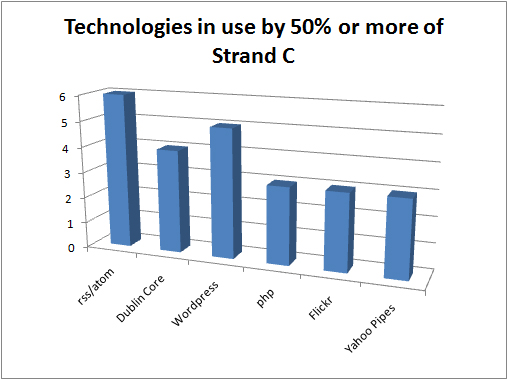
Graph of technologies and standards in us by 50% or more of Strand C projects
Although aspects of the call might have shaped the projects’ technical choices to some extent, a few things stand out:
- the focus on RSS/Atom feeds and tools to manipulate them
- reflection: this matches the approach taken by many of the other aggregators and discovery services for OER and other learning materials as well as the built in capabilities of a number of the platforms in use [nb "syndicated via RSS/Atom" was a programme requirement]
- a relative lack of a use of OAI-PMH
- reflection: is this indicative of how many content providers and aggregators in the learning material’s consume or output OAI-PMH?
- substantial use or investigation of wordpress and custom databases (with php frontends)
- reflection: are repositories irrelevant here because they don’t offer easy ways to add plugins or aggregate others’ content (or are there other factors which make WordPress and a custom database more appealing)
Community
One of the critical issues for all of these projects in the creation of these collections has been the role of community; for some of the strand projects the subject community played a crucial role in developing the static collection which then fed, framed, or seeded the dynamic collection, for other projects the subject community formed the basis of contributing resources to the dynamic collection.
Although the projects had to be “closely aligned with relevant subject or thematic networks – for example Academy Subject Centres, professional bodies and national subject associations” , I find it striking that many of the projects made those defined communities an integral part of their discovery process and not just an audience or defining domain.
Reflections on community
I’m hoping someone else is able to explore the role of community in discovery services more fully (if not I’ll try to come back to this) but I’ve been struck by the model used by some projects in which a community platform is the hook leading to resource discovery. It’s the opposite end of the spectrum to Google – to support discovery you create a place and content accessible and relevant to a specific subject domain. The place you create both hosts new content created by a specific community and serves as a starting point to point to further resources elsewhere (whether those pointers are links, learning pathways, or tweaked plugin searches run on aggregators or repositories). This pattern mirrors any number of thriving community sites (typically?) outside of academia that happily coexist in Google’s world providing specialist sources of information and community portals (for example about knitting, cooking, boardgames).
What it doesn’t mirror is trying to entice academics to use a repository… [I like repositories and think they're very useful for some things , but this and the examples of layering CMSs on top of repositories, increasingly makes me think that on their own they aren't a great point of engagement for anybody...]