Betweenness Centrality – helping us understand our networks

Like many others I’m becoming increasingly interested in the many ways we can now start to surface and visualise connections on social networks. I’ve written about some aspects social connections and measurement of networks before.

My primary interest in this area just now is more at the CETIS ISC (innovation support centre) level, and to explore ways which we can utilise technology better to surface our networks, connections and influence. To this end I’m an avid reader of Tony Hirst’s blog, and really appreciated being able to attend the recent Metrics and Social Web Services workshop organised by Brian Kelly and colleagues at UKOLN to explore this topic more.

Yesterday, promoted by a tweet of a visualisation of the twitter community at the recent eAssessment Scotland conference, the phrase “betweenness centrality” came up. If you are like me, you may well be asking yourself “what on earth is that?” And thanks to the joy of twitter this little story provides an explanation (the zombie reference at the end should clarify everything too!)

View “Betweenness centrality – explained via twitter” on Storify

In terms of CETIS, being able to illustrate aspects of our betweenness centrality is increasingly important. Like others involved in innovation and community support, it is often difficult to qualify and quantify impact and reach, and we often have to rely on anecdotal evidence. On a personal level, I do feel my own “reach” an connectedness has been greatly enhanced via social networks. And through various social analysis tools such as Klout, Peer Index and SocialBro I am now gaining a greater understand of my network interactions. At the CETIS level however we have some other factors at work.

As I’ve said before, our social media strategy has raised more through default that design with twitter being our main “corporate” use. We don’t have a CETIS presence on the other usual suspects Facebook, Linkedin , Google+. We’re not in the business of developing any kind of formal social media marketing strategy. Rather we want to enhance our existing network, let our community know about our events, blog posts and publications. At the moment twitter seems to be the most effective tool to do that.

Our @jisccetis twitter account has a very “lite” touch. It primarily pushes out notifications of blog posts and events, we don’t follow anyone back. Again this is more by accident by design, but this has resulted in a very “clean” twitter stream. On a more serious note, our main connections are built and sustained through our staff and their personal interactions (both online and offline). However, even with this limited use of twitter (and I should point out here that not all CETIS staff use twitter) Tony has been able to produce some visualisations which start to show the connections between followers of the @jisccetis account and their connections. The network visualisation below shows a view of those connections sized by betweenness centrality.
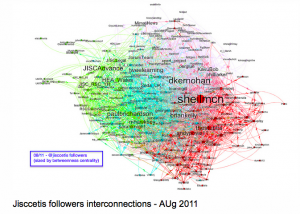
@jisccetis twitter followers betweenness centrality

So using this notion of betweenness centrality we can start to see, understand and identify some key connections, people and networks. Going back to the twitter conversation, Wilbert pointed out ” . . . innovation tends to be spread by people who are peripheral in communities”. I think this is a key point for an Innovation Support Centre. We don’t need to be heavily involved in communities to have an impact, but we need to be able to make the right connections. One example of this type of network activity is illustrated through our involvement in standards bodies. We’re not at always at the heart of developments but we know how and where to make the most appropriate connections at the most appropriate times. It is also increasingly important that we are able to illustrate and explain these types of connections to our funders, as well as allowing us to gain greater understanding of where we make connections, and any gaps or potential for new connections.

As the conversation developed we also spoke about the opportunities to start show the connections between JISC funded projects. Where/what are the betweenness centralities across the e-Learning programme for example? What projects, technologies and methodologies are cross cutting? How can the data we hold in our PROD project database help with this? Do we need to do some semantic analysis of project descriptions? But I think that’s for another post.
SEMHE ’11 – Call for papers

The 3rd SemHE workshop (Semantic Web Applications in Higher Education) will take place this September and will be co-located with EC-TEL’11 this September in Palermo.

The workshop organisers are hoping that it will attract people working on semantic web applications in HE and those who have been developing linked data infrastructures for the HE sector. The workshop will address the following themes:

– Semantic Web applications for Learning and Teaching Support in Higher Education.
– Use of linked data in repositories inside or across institutions.
– Collaborative learning and critical thinking enabled by semantic Web applications.
– Interoperability among Universities based on Semantic Web standards.
– Ontologies and reasoning to support pedagogical models.
– Transition from soft semantics and lightweight knowledge modelling to machine processable, hard semantics.
– University workflows using semantic Web applications and standards.

The deadline for submissions is 8 July and full information is available at the workshop website.

The University of Southampton opening up its data

The University of Southampton have just launched their Open Data Home site, providing open access to some of the University’s administrative data.

The Open Data Home site provides a number of RDF data sets from teaching room features to on campus bus-stops, a range of apps showing how the University itself is using the data, and their own SPARQL endpoint to query the data. As well as links to presentations from linked data luminaries Tim Berners-Lee and Nigel Shadbolt, the site also contains a really useful FAQ section. This question in particular is one I’m sure lots of institutions will be asking, and what a great answer.

“Aren’t you worried about the legal and social risks of publishing your data?
No, we are not worried. We will consider carefully the implications of what we are publishing and manage our risk accordingly. We have no intention of breaking the UK Data Protection Act or other laws. Much of what we publish is going to be data which was already available to the public, but just not as machine-readable data. There are risks involved, but as a university — it’s our role to try exciting new things!”

Let’s hope we see many more Universities following this example in the very near future.

Happy New Media Year

Over the holidays I’ve tried to take a proper break from twitter. It’s becoming such an integral part of my work life, I wanted a break. However, twitter is one of those things that does cross work/life boundaries so it is hard to keep completely away and tonight (again) twitter and the BBC illustrated the power of the social web and data visualisation.

In case you weren’t aware tonight was the 60th anniversary of the equally loved and maligned radio soap “The Archers“. Tension has been building in the press over the past few weeks. Being Radio 4 it’s been in all the broadsheets!

Ultimately this extended half hour episode was a bit of a let down (no thud, not that much screaming). But the twitter stream using the #sattc (shake Ambridge to the core) hash tag more than made up for script deficits. And the live website, mashing up tweets and plot lines with some great visualisations really showed how real-time social data from an engaged and (mostly) articulate community can be used.

I’m hoping in 2011 we’ll be able to see some similar experiments within the educational community. What’s our equivalent sattc hash tag? What messages can we effectively visualise – innovation? impact? itcc (in the current climate)? And how can we ensure that the people making decisions about funding for HE can see the the collective thoughts of our equally engaged and articulate community?

Learning for the future, TEPL SIG and George Siemens

Sometimes adverse weather conditions can work in your favour and our increasingly connected world is making it far easier to cope without being in an office. Yesterday, I was supposed to be in Oxford at a Sakai implementation meeting, but due to the weather I decided that it probably wasn’t the best idea to be venturing out on planes and trains. However, through the magic of twitter I spied that the talk by George Siemens at Glasgow Caledonian University was being streamed, so I logged in and was able to join the TEPL SIG meeting. Simultaneously, again through the magic of twitter, I was also able to keep an eye on what was happening in Oxford via the #sakaiuk twitter stream.

Formerly the Supporting Sustainable eLearning SIG, the Technology Enhanced Professional Learning (TELP) SIG has held a series of seminars around key challenges for learning; learning for work; learning to learn; learning for change and the topic George Siemens tackled yesterday – learning for the future.

As George talked about increased connectivity, the role of activity streams such as twitter feeds, and the notion of fluid centres of information coalescing around topics/communities at different times. I couldn’t help reflecting that this increasingly how my working life is lived (for want of a better word). In my context, being (almost) constantly connected, and having fluid information centres actually allows me to far more effective and as yesterday so clearly illustrated, almost be in three places at once. However, for traditional HE and in fact any level of education, moving from the traditional boundaries of the (almost totally teacher) pre-determined course to one that is more connected and fluid such as the Massively Open Online courses George runs with Stephen Downes and others is still a huge challenge. How can everyday teaching and learning practice adapt to use these fluid centres effectively?

George also spoke about the notion of the world of data, and how we need to recognise that all our online interactions are data too. Increasingly it is our data streams which define us and more importantly how others perceive us. I already find it scary how accurate some retailers are at customer profiling and sending me links to books I want to read before I know I want to read them. And of course, the recent twitter joke trial and the current situation with wikileaks are starting to draw new battlelines around freedom of speech, freedom of information and covert (and not so covert) government pressure on service providers and individuals.

However on a more positive note, George talked about the iKLAM (integrated knowledge and learning analytics) model, which looks at bringing together physical and locational data with online activities to improve personal learning knowledge evaluation. This could be a key transition point allowing the move from the traditional “bounded” course to a place where “intelligent curriculum meets analytics meets social network meets personal profile” which would bring more peer participatory pedagogy. A semantic curriculum could also bring around shifts in assessment allowing more augmented, peer related, and more engaging.

Of course, George did acknowledge that this shift was not a natural progression and our institutional culture is not going to change overnight. However I do think that we are starting to see changes in attitudes towards data, and more importantly the effective use of data.

In the JISC Curriculum Design programme, great leaps are being made by projects in terms of streamlining their data collection processes and workflows for course approval and validation and relating them to what is actually delivered. The Dynamic Learning Maps project (part of the JISC Curriculum Delivery programme) is an example of bringing a variety of institutional based information and allowing students to add/personalise their maps with their own resources. The LUCERO project at the OU is investigating use linked data for courses and Liam Green-Huges has just written an guest blog on his experiments with their linked data store, including using course data in Facebook. Well worth a read if you are interested in using linked data.

I had to delve into other steams in the afternoon, but the discussions continued and a top ten recommendations for future learning were created:

    1. Open up educational resources
    2. Widen out debate discussion on Connections, Clouds, Things, and Analytics
    3. Think of how to readically change professional learning/staff development in higher education to embrace these ideas
    4. Think about the skills/ compenetcies and minsets required of academics for future learning
    5. Move away from the ‘one size fits all’ IT model
    6. Change the mindsets of academics required for future
    7. Find ways to implement and use analytics
    8. Rethink assessment – not just content but the ‘form’ of assessment as well
    9. Make sure organisational change is constant (e.g. continual professional learning)
    10. Consider the necessity of digital literacies and what this means for the intelligent curriculum

George’s presentation is available on slideshare.

Talis platform day

Last Friday I attended one the current series of Talis platform days in Manchester. The days are designed to give an introduction to linked data, how to work with open data sets and show examples of linked data in action from various sources including Talis.

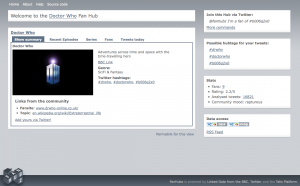
In the morning the Talis team gave us overview of linked data principles, the Talis platform itself and some real life examples of sites they have been involved in. A couple of things in particular caught my attention including FanHubz . This has been developed as part of the BBC backstage initiative, and uses semantic technologies to surface and build communities around programmes such as Dr Who.

Dr Who fanhubz

It did strike me that we could maybe start to build something similar for JISC programmes we support by using the programme hash tag, project links, and links from our PROD database (now Wilbert is beginning to semantify it!). This idea also reminded me of the Dev8 happiness rating.

Leigh Dodds gave a comprehensive overview of the Talis platform which you can free account for and play around with. The design principles are solid and it is based on open standards with lots of restful service goodness going on. You can find out more at their website.

There are two main areas in the data store, one for unstructured data which is akin to an amazon data store, and one structured triple store area – the metabox. One neat feature of this side of things was the augmented search facility, or as Leigh called it “fishing for data”. You can pipe an existing RSS1.0 feed through a data store and the platform will automagically enrich it with available linked data and pass out another augmented feed. This could be quite handy for finding new resources, and OERs ran through my mind as it was being explained.

The afternoon was given over to more examples of linked data in action, including some Ordinance Survey open maps and genealogy mash-ups leading to bizarre references to Kajagoogoo (and no, I can’t quite believe I’m writing about them either, but hey if they’re in DBpedia, they’re part of the linked data world).

We then had an introductory SPARQL tutorial. Which, mid afternoon on a Friday was maybe a bit beyond me – but I certainly have a much clearer idea of what SPARQL is now and how it differs from other query languages.

If you are interested in getting an overview of linked data, and an overview of SPARQL, then do try and get along to one of these events, but be quick as I think there is only one left in this current series.

Presentations from the day are available online.

Platform Open days

For those of you interested in finding out more about approaches to working with linked data sets, SPARQL and “all that stuff”, Talis are running a series of platform open days. The first of these will be held on 14 May in Manchester, and the Talis team are keen to get some input from the educational sector.

The day will give an overview of Linked Data including what it means to make Data into “Linked Data”, an overview of RDF, and a tutorial of SPARQL. There will also be a “Linked Data in Action” talk, giving many examples and live demonstrations of apps, mashups and visualisations built on Linked Data. The idea is to give anyone who is curious about the Semantic Web and Linked Data a firm basis on which to build. Also, if you are already working/just starting to work in this area and have any specific problems then the Talis team will be on hand to help solve your problem.

So, if you are interested in having learning more about Linked Data, SPARQL and working with datasets from the BBC, UK Government, and maybe even sharing your own data sets, then sign up here. The event is free to attend but there are only 30 places.

The Manchester event also coincides with the FutureEverything festival in Manchester that week.

2nd Linked Data Meetup London

Co-located with the dev8D, the JISC Developer Days event, this week, I along with about 150 others gathered at UCL for a the 2nd Linked Data Meetup London.

Over the past year or so the concept and use of linked data seems to be gaining more and more traction. At CETIS we’ve been skirting around the edges of semantic technologies for some time – tying to explore realization of the vision particularly for the teaching and learning community. Most recently with our semantic technologies working group. Lorna’s blog post from the last meeting of the group summarized some potential activity areas we could be involved in.

The day started with a short presentation from Tom Heath, Talis, who set the scene by giving an overview of the linked data view of the web. He described it as a move away from the document centric view to a more exploratory one – the web of things. These “things” are commonly described, identified and shared. He outlined 10 task with potential for linked data and put forward a case for how linked data could enhance each one. E.g. locating – just now we can find a place, say Aberdeen, however using linked data allows us to begin to disambiguate the concept of Aberdeen for our own context(s). Also sharing content, with a linked data approach, we just need to be able to share and link to (persistent) identifiers and not worry about how we can move content around. According to Tom, the document centric metaphor of the web hides information in documents and limits our imagination in terms of what we could do/how we could use that information.

The next presentation was from Tom Scott, BBC who illustrated some key linked data concepts being exploited by the BBC’s Wildlife Finder website. The site allows people to make their own “wildlife journeys”, by allowing them to explore the natural world in their own context. It also allows the BBC to, in the nicest possible way, “pimp” their own progamme archives. Almost all the data on the site, comes from other sources either on the BBC or the wider web (e.g. WWF, Wikipedia). As well as using wikipedia their editorial team are feeding back into the wikipedia knowledge base – a virtuous circle of information sharing. Which worked well in this instance and subject area, but I have a feeling that it might not always be the case. I know I’ve had my run-ins with wikipedia editors over content.

They have used DBPedia as a controlled vocabulary. However as it only provides identifiers, and no structure they have built their own graph to link content and concepts together. There should be RDF available from their site now – it was going live yesterday. Their ontology is available online.

Next we had John Sheridan and Jeni Tennison from data.gov.uk. They very aptly conceptualised their presentation around a wild-west pioneer theme. They took us through how they are staking their claim, laying tracks for others to follow and outlined the civil wars they don’t want to fight. As they pointed out we’re all pioneers in this area and at early stages of development/deployment.

The data.gov.org project wants to:
* to develop social capital and improve delivery of public service
*make progress and leave legacy for the future
*use open standards
*look at approaches to publishing data in a distributed way

Like most people (and from my perspective, the teaching and learning community in particular) they are looking for, to continue with the western theme, the “Winchester ’73” for linked data. Just now they are investigating creating (simple) design patterns for linked data publishing to see what can be easily reproduced. I really liked their “brutally pragmatic and practical” approach. Particularly in terms of developing simple patterns which can be re-tooled in order to allow the “rich seams” of government data to be used e.g. tools to create linked data from Excel. Provenance and trust is recognised as being critical and they are working with the W3C provenance group. Jeni also pointed that data needs to be easy to query and process – we all neglect usability of data at our peril. There was quite a bit of discussion about trust and John emphasised that the data.gov.uk initiative was about public and not personal data.

Lin Clark then gave an overview of the RDF capabilities of the Drupal content managment system. For example it has default RDF settings and FOAF capability built in. The latest version now has an RDF mapping user interface which can be set up to offer up SPARQL end points. A nice example of the “out of the box” functionality which is needed for general uptake of linked data principles.

The morning finished with a panel session where some of key issues raised through the morning presentations were discussed in a bit more depth. In terms of technical barriers, Ian Davies (CEO, Talis) said that there needs to be a mind shift for application development from one centralised database to one where multiple apps access multiple data stores. But as Tom Scott pointed out it if if you start with things people care about and create URIs for them, then a linked approach is much more intuitive, it is “insanely easy to convert HTML into RDF “. It was generally agreed that the identifying of real world “things”, modelling and linking of data was the really hard bit. After that, publishing is relatively straightforward.

The afternoon consisted of a number of themed workshops which were mainly discussions around the issues people are grappling with just now. I think for me the human/cultural issues are crucial, particularly provenance and trust. If linked data is to gain more traction in any kind of organisation, we need to foster a “good data in, good data out” philosophy and move away from the fear of exposing data. We also need to ensure that people understand that taking a linked data approach doesn’t automatically presume that you are going to make that data available outwith your organisation. It can help with internal information sharing/knowledge building too. Of course what we need are more killer examples or winchester 73s. Hopefully over the past couple of days at Dev8 progress will have been made towards those killer apps or at least some lethal bullets.

The meet up was a great opportunity to share experiences with people from a range of sectors about their ideas and approaches to linked data. My colleague Wilbert Kraan has also blogged about his experiments with some of our data about JISC funded projects.

For an overview of the current situation in UK HE, it was timely that Paul Miller’s Linked Data Horizon Scan for JISC was published on Wednesday too.

Semantic technologies in teaching and learning working group – first meeting

The first meeting of the semantic technologies in teaching and learning working group took place at the University of Strathclyde on Friday 3 October.

The SemTec project outlined their project and there was a general discussion re the proposed methodology, scope and community engagement. A twine group has been established for the working group ( if you want an invitation, let me know). The next WG meeting will be in December sometime dates and location to be confirmed, followed by a public meeting early 2009.

More information on the working group is available on the intrawiki