Data, data everywhere data, but what do we actually do with it? Do we need “big” data in education? What is it we are trying to find out? What is our ROI both at institutional and national levels? Just some the questions that were raised at the Analytics and Institutional Capabilities session at #cetis13 last week.
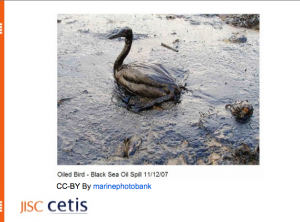
Is data our new oil? asked Martin Hawksey in his introduction to the session. And if, as many seem to think, it is, do we we really have the capabilities to “refine” it properly? How can we ensure that we aren’t putting the equivalent of petrol into a diesel engine? How can we ensure that institutions (and individuals) don’t end getting trapped in a dangerous slick of data? Are we ensuring that everyone (staff and students) are developing the data literacy skills they need to use and ultimately understand the visualisations we can produce from data?

Bird in an oil slick
Ranjit Sidhu (Statistics into Decisions) gave an equally inspiring and terrifying presentation around the hype of big data. He pointed out that in education “local data” and not “big data” is really where we should be focusing our attention, particularly in relation to our core business of attracting students. In relation to national level data he also questions the ROI on some “quite big” data national data collection activities such as the KIS. From the embarrassingly low figures he showed us of the traffic to the UniStats site, it would appear not. We may have caused a mini spike in the hits for one day in March ![]()
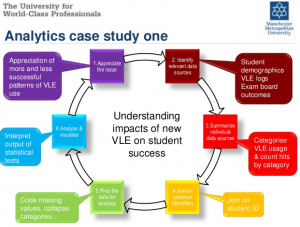
However, there are people who are starting to ask the right questions and use their data in ways that are meaningful. A series of lightning talks which highlighted a cross section of approaches to using institutional data. This was followed by three inspiring talks from Jean Mutton (University of Derby), Mark Stubbs (MMU) and Simon Buckingham Shum (OU). Jean outlined the work she and her team have been doing at Derby on enhancing the student experience (more information on this is available through our new case study); Mark then gave a review of the work they have been doing around deeper exploration of NSS returns data and their VLE data. Both Jean and Mark commented that their work started without them actually realising they were “doing analytics”. Marks analytics cycle diagram was really useful in illustrating their approach.

screen shot of analtyics cycle
Simon, on the other hand, of course very much knew that he was “doing analytics” and gave an overview of some the learning analtyics work currently being undertaken at the OU, including a quick look at some areas FutureLearn could potentially be heading.
Throughout all the presentations the key motivator has, and continues to be, framing and then developing the “right” questions to get the most out of data collection activity and analysis.
More information including links to the slides from the presentations are available on the CETIS website.