Analytics for Teaching and Learning

It’s all been about learning analytics for me this week. Following the SoLAR UK meeting on Monday, I’m delighted to announced that next paper in the CETIS Analytics Series, “Analytics for Teaching and Learning” launches today.

Building on from “Analytics for the Whole Institution, balancing strategy and tactics“, this paper (written by Mark Van Harmelen and David Workman) takes a more in-depth look at issues specifically related to applying analytics in teaching and learning.

The Analytics for Teaching and Learning paper examines:

” the use of analytics in education with a bias towards providing information that may help decision makers in thinking about analytics in their institutions. Our focus is pragmatic in providing a guide for this purpose: we concentrate on illustrating uses of analytics in education and on the process of adoption, including a short guide to risks associated with analytics.”

Learning analytics is an emerging field of research and holds many promises of improving engagement and learning. I’ve been following developments with interest and I hope a healthy level of scepticism and optimism. A number of VLEs (or LMSs if you’re in North America) are now shipping with built in analytics features aka dashboards. However, as I pointed out in the “Analytics, what is changing and why does it matter?” paper, there really isn’t a “magic analytics” button which will suddenly create instantly engaged students and better results. Effective use and sense making of any data requires lots of considerations. You need to think very carefully about the question(s) you want the data help you to answer and then ensure that results are shared with staff and students in ways that allow them to gain “actionable insights”. Inevitably the more data you gather, the more questions you will ask. As Adam summarised in his “how to do analytics right” post a simple start can be best. This view was echoed at discussions during the SoLAR meeting on Monday.

Starting at small scale, developing teams, sharing data in meaningful ways, developing staff/student skills and literacies are all crucial to successful analytics projects. The need for people with both data handling, interpretation and within education, pedagogic understanding is becoming more apparent. As the paper points out,

“There are a variety of success factors for analytics adoption. Many of them are more human and organisational in nature than technical. Leadership and organisational culture and skills matter a lot.”

Again if you have any thoughts/experiences to share, please feel free to leave a comment here.

The paper can be downloaded from here.

Quick links from SoLAR Flare meeting

So we lit the UK SoLAR Flare in Milton Keynes yesterday, and I think it is going to burn brightly for some time. This post is just a quick round up of some links to discussions/blogs/tweets and pics produced over the day.

Overviews of the presentations and discussions were captured by some live blogging from Myles Danson (JISC Programme Manager for our Analytics Series)

and Doug (master of the live blog) Clow of the OU.

Great overview of the day – thanks guys!

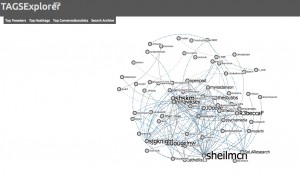
And our course we have some twitter analytics thanks to our very own Martin Hawksey’s TAGs archive for #FlareUK and the obligitory network diagram of the twitter stream (click the image to see larger, interactive version)

#FlareUK hashtag user community network

Slides from the morning presentations and subsequent group discussions are available from the the SoLAR website, and videos of the morning presentations will be available from there soon too.

As a taster of the day – here’s a little video of what went on.

Analytics for the Whole Institution; Balancing Strategy and Tactics

Following on from last week’s introductory and overview briefing paper, Analytics, what is changing and why does it matter?, this week we start to publish the rest of our series, beginning with “Analytics for the Whole Institution; Balancing Strategy and Tactics” (by David Kay and Mark van Harmelen)

Institutional data collection and analysis is not new to institutions, and most Higher Education Institutions and Further Education Colleges do routinely utilise collect data for a range of purposes, and many are using Business Intelligence (BI) as part of their IT infrastructure.

This paper takes an in-depth look as some of the issues which “pose questions about how business intelligence and the science of analytics should be put to use in customer facing enterprises”.

The focus is not on specific technologies, rather on how best to act upon the potential of analytics and new ways of thinking about collecting, sharing and reusing data to enable high value gains in terms of business objectives across an organisation.

There a number of additional considerations when trying to align BI solutions with some of the newer approaches now available for applying analytics across an organisiation.  For example, it is not uncommon for there to be a disconnect between gathering data from centrally managed systems and specific teaching and learning systems such as VLEs. So at a strategic level, decisions need to be taken about overall data management, sharing and re-use e.g. what sytems hold the most useful/ valuable data? What formats is avaiable in? Who has access to the data and how can it be used to develop actional insights? To paraphrase from a presentation I gave with my colleague Adam Cooper last week “how data ready and capabile is your organisation?”, both in terms of people and systems.

As well as data considerations, policies (both internally and externally) need to be developed in terms of ethical use of data, and also in terms of developing staff and the wider organisational culture to developed data informed practices. Of course, part of the answers to these issues lie in sharing in the sharing and development of practice through organisations suchs as JISC. The paper highlights a number of examples of JISC funded projects.  

Although the paper concentrates mainly on HEIs, many of the same considerations are relevant to the Further Education colleges. Again we see this paper as a step in widening participation and identifying areas for further work. 

At an overview level the paper aims to:

*Characterise the educational data ecosystem, taking account of both institutional and individual needs
*Recognise the range of stakeholders and actors – institutions, services (including shared above-campus and contracted out), agencies, vendors
*Balance strategic policy approaches with tactical advances
*Highlight data that may or may not be collected
*Identify opportunities, issues and concerns arising

As ever we’d welcome feedback on any of the issues raised in the paper, and sharing of any experiences and thoughts in the comments.

The paper is available to download from here.

Analytics, what is changing and why does it matter?

A couple of tricky questions in that title, but hopefully some answers are are provided in a series of papers we are launching today.

The CETIS Analytics Series consists of 11 papers, written by a range of our staff (and some commissioned pieces) looking at a range of topics relevant to Analytics in education. The series is intended to provide a broad landscape of the history, context, issues and technologies of Analytics in post 16 education, and in particular the UK context.

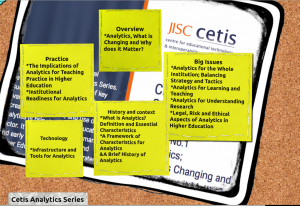
As this diagram below illustrates, the series covers four main areas: “big issues” which consists of in depth reports on issues relating to the whole institution including ethical and legal, learning and teaching, research management; “history and context” which looks at the history and development of analytics in more generally; “practice” which looks some of the issues around implementing analytics particularly in HE institutions; and “technology” which reviews a number of technologies and tools available just now.

The Cetis Analytics Series Graphic
(click graphic to see larger image)

The series provides a background, critique and pointers to current and future developments to help managers and early adopters develop their thinking and practice around the use of analytics. As Adam Cooper highlights

“Analytics is the process of developing actionable insights through problem definition and the application of statistical models and analysis against existing and/or simulated future data.”

We hope that the papers will help people in developing processes to not only identify actionable insights, but also how to develop processes, and more importantly, the staff/student skills and literacies, to produce measurable impacts across the range of activities undertaken in educational organisations such as universities and colleges. As Nate Silver demonstrated in the recent US election, it’s not just about having the data, it’s being able make sense of it and communicate findings effectively that makes the difference.

Given the that this is a rapidly developing field, it is impossible to cover every everything, but we hope that the papers will provide a solid basis for discussion and pointers for further work. Of course as well as the papers, we continue to report on our work and thoughts around data and analytics. For example, over the past month or so, Sharon Perry has been summarising a number of significant outputs and findings from the JISC Relationship Management Programme on her blog. Next week we co-host the inaugural UK SoLAR Flare with colleges from the OU (UK) which will provide another opportunity to help identify key areas for further research and collaboration.

We’ll be publishing the papers between now and early January, and each will have an accompanying blog post providing bit more context for each and the opportunity for feedback and discussion. Below is a list of titles with the week of its publication.

* Analytics for the Whole Institution; Balancing Strategy and Tactics (19th November)
* Analytics for Learning and Teaching (22 November)
* Analytics for Understanding Research (22 November)
* What is Analytics? Definition and Essential Characteristics (4 December)
* Legal, Risk and Ethical Aspects of Analytics in Higher Education (4 December)
* A Framework of Characteristics for Analytics (18 December)
* Institutional Readiness for Analytics (19 December)
* A Brief History of Analytics (8 January)
* The Implications of Analytics for Teaching Practice in Higher Education (8 January)
* Infrastructure and Tools for Analytics (15 January)

Today we start with an overview briefing paper which provides and overview and sets the context for the series. You can download the paper from the link below.

*Analytics, what is changing and why does it matter ? briefing paper.

Lighting the UK SoLAR Flare

I’m delighted to announce that CETIS and the OU are co-sponsoring the first UK SoLAR Flare meeting on Monday 19th November in Milton Keynes.

This is the first UK gathering dedicated to the field of Learning Analytics. Under the auspices of SoLAR (Society for Learning Analytics Research).

Part of SoLAR’s mission is to improve the quality of dialogue within and across the many stakeholders impacted by Learning Analytics. Flare events are “a series of regional practitioner-focused events to facilitate the exchange of information, case studies, ideas, and early stage research.”

We are therefore inviting technology specialists, researchers, educators, ICT purchasing decision-makers, senior leaders, business intelligence analysts, policy makers, funders, students, and companies to join us in Milton Keynes for this inaugural event.

We’ve designed the day to maximise social learning with plenty of opportunity to meet with peers and explore collaboration possibilities, the chance to hear — and share — lightning updates on what’s happening and the opportunity to shape future Flares.

So if you’re involved in any aspect of analytics and want to share your work, or would just like to find out more, join us in Milton Keynes. The event is free to attend, but places are limited, so book quickly.

Big data, learning analytics, a crack team from the OU . . . and me

Yesterday I was part of a panel in the Big Data and Learning Analtyics Symposium at ALT-C.   Simon Buckingham Schum, Rebecca Fergusson, Noami Jeffrey, Kevin Mayles and Richard Nurse the “crack team” from the OU gave a really useful overview of the range of work they are all undertaking in the OU. Simon’s blog has details of the session and our introductory slides.

We were pleasantly surprised by the number of delegates who came to the session given we were scheduled at the same time as yesterday’s invitied speakers Professor Mark Stubbs and Sarah Porter. The level of discussion and interest indicated the growing realisation of the potential and the challenges for analytics across the education sector.

As ever it is hard to report effectively on a discussion session however a few issues which seemed to resonate with everyone in the room were:

*the danger of recommendation systems reducing and not extending choice 
*data driven v data deterimistic decision making
*the difference between measuring success and success in learning – they are not the same
*the danger of “seduction by stats” by senior management
*the need for the development of new skills sets and roles within institutions based on data science but with the ability to communicate with all staff to help question the data. 
*the increased need for development of statistical literacy for all staff and students 
*the potential for learning analytics in terms of expanding the flipped classroom model allowing teachers and students more time for sense making and actually thinking about the teaching and learning process.

Many of these issues will be covered in a series of papers we will be releasing next month as part of our Reconnoitre work.  And the discussions will be continued at a SoLAR meeting in November which we are co-hosting with the OU (more details on that in the next few days).


Confronting Big Data and Learning Analytics @ #altc2012

Next Thursday morning I’m participating in the Big Data and Learning Analytics symposium at ALT-C 2012 with colleagues from the OU, Simon BuckinghamShum, Rebecca Ferguson, Naomi Jeffery, Kevin Mayles and Richard Nurse.

The session will start will a brief overview from me of the analytics reconnoitre that CETIS is currently undertaking for JISC, followed by short overviews from different parts of the OU on a number of analytics projects and initiatives being undertaken there. We hope the session will:

“air some of the critical arguments around the limits of decontextualised data and automated analytics, which often appear reductionist in nature, failing to illuminate higher order learning. There are complex ethical issues around data fusion, and it is not clear to what extent learners are empowered, in contrast to being merely the objects of tracking technology. Educators may also find themselves at the receiving end of a new battery of institutional ‘performance indicators’ that do not reflect what they consider to be authentic learning and teaching.”

We’re really keen to have open discussion with delegates and engage with their views and experiences in relation to big data and learning analytics. So, come and join us bright and early (well, 9am) on Thursday. If you can’t make the session, but have some views/experiences then please feel free to leave comments here and I’ll do my best to raise them at the session and in my write up of the it.

More information about the session is available here.

Some thoughts on web analytics uisng our work on analytics

As I’ve mentioned before, CETIS are in the middle of a piece of work for JISC around analytics in education (our Analytics Reconnoitre project). You may have noticed a number of blog posts from myself and colleagues around various aspects of analytics in education. We think this is a “hot topic” but is it? Can our analytics help us to gauge interest?

CETIS, like many others, is increasingly using Google Analytics to monitor traffic on our website. We are also lucky to have in Martin Hawksey, a resident google spreadsheet genius. Since Martin has come to work with us, we have been looking at ways we can use some of his “stuff” to help us develop our communications work, and gain more of an understanding of how people interact with our overall web presence.

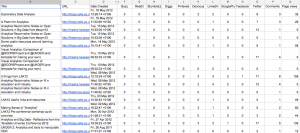
As part of the recent CETIS OER visualisation project, Martin has explored ways of tracking social sharing of resources. Using this technique Martin has adapted one of his spreadsheet so that it not only takes in google analytics from our CETIS blog posts, but also combines the number of shares a post is getting from these social sharing sites: Buzz, Reddit, Stumbleupon, Diggs, Pinterest, Delicious, Google+, Facebook and Twitter. By adding the the rss feed from our Analytics topic area, we get a table like this which combines the visit and comments information with the number of shares a post gets on each of the sharing sites.

social sharing stats for JISC CETIS analytics topic feed

(NB Martin’s blog is not hosted on our CETIS server so we can’t automagically pull his page view info in this way which is why there is a 0 value in the page view column for his posts, but I think we can safely say that he gets quite a few page views)

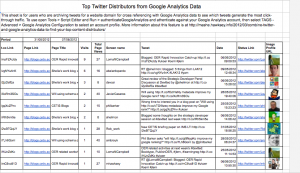
From this table it is apparent that Twitter is the main way our posts are being shared. Linkedin comes in second with delicious and google+ also generating a few “shares”. The others get virtually no traffic. We already knew that twitter is a key amplification tool for us, and again Martin’s magic has allowed us to create a view of the top click throughs from Twitter on our blog posts.

JISC CETIS Top twitter distributers

We could maybe be accused of playing the system, as you can see a number of our top re-tweeters are staff members – but if we can’t promote our own stuff, then we can hardly expect anyone else to!

But I digress, back to the main point. We can now get an overview of traffic on a particular topic area, and see not only the number of visits and comments it is getting but also where else it is being shared. We can then start to make comparisons across topic areas.

This is useful on a number of levels beyond basic web stats. Firstly, it gives us another view on how our audience shares and values our posts. I think we can say that if someone book marks a post, they do place some value on it. I would hesitate to start to quantify what that value is, but increasingly we are being asked about ROI so it is something we need to consider. Similarly with re-tweets, if something is re-tweeted they people want to share that resource and so feel that it is of value to their twitter network. I don’t see a lot of bot retweets in the my network. It also allows us to share and evaluate more information not only internally, but also with our funders (and through posts like this) our community.

It also raises some questions wider questions about resource sharing and web analytics in general. Martin raised this issue last year with this post which sparked this reply from me. The questions I raised there are still on my mind, and increasingly as I explore this more in the context of CETIS, I think I am beginning to see more evidence of the habits and practice of our community.

Twitter is a useful dissemination channel, and increasingly a key way for peer sharing of information. The use of other social sharing sites, would appear to be not so much. Tho’ I was surprised to see relatively high numbers for linked in. Again this might be down to the “professional” nature of linked in – or the fact that I am an unashamed social media tart, and repost all my blog posts in linked in too :-) We also have sharing buttons on the bottom of our posts which have very obvious buttons for twitter, linked in and Facebook.

In terms of other social sharing sites, are these just more a question of people’s own work practices and digital literacies? Are these spaces seen as more private? Or is it just that people still don’t really use them that much, did the delicious debacle affect our trust in such sites? Should we encourage more sharing by having more obvious buttons for the other sites listed in the table? And more importantly should JISC and its funded services and projects be looking towards these sites for more measures of impact and engagement? Martin’s work illustrates how you can relatively easily combine data from different sources, and now there are some templates available there really isn’t a huge time cost to adapt them, but are they gathering the relevant data? Do we need to actively encourage more use of social sharing sites? I’d be really interested to hear of any thoughts/ experiences other have of any of these issues.

Some useful resources around learning analytics

As I’ve mentioned before, and also highlighted in a number of recent posts by my colleagues Adam Cooper and Martin Hawskey, CETIS is undertaking some work around analytics in education which we are calling our Analytics Reconnoitre.

In addition to my recent posts from the LAK12 conference, I thought it would be useful to highlight the growing number of resources that the our colleagues in Educause have been producing around learning analytics. A series of briefing papers and webinars are available which covering a range of issues around the domain. For those of you not so familiar with the area, a good starting point is the “Analytics in Education: Establishing a Common Language” paper which gives a very clear outline of a range of terms being used in the domain and how they relate to teaching and learning.

For those of you who want to delve a bit deeper the resource page also links to the excellent “The State of Learning Analytics in 2012: A Review and Future Challenges” report by Rebecca Ferguson, from the OU’s KMI, which gives a comprehensive overview of the domain.

5 things from LAK12

Following that challenge, I’m going to try and summarise my experiences and reflections on the recent LAK12 conference in the five areas that seemed to resonate with me over the 4 days of the conference (including the pre conference workshop day) which are: research, vendors, assessment, ethics and students.

Research
Learning Analytics is a newly emerging research domain. This was only the second LAK conference, and to an extent the focus of the conference was on trying to establish and benchmark the domain. Aberlardo has summarised this aspect of the conference far better than I could. Although I went to the conference with an open mind, and didn’t have set expectations I was struck by the research focus of the papers, and the lack of large(r) scale implementations. Perhaps this is due to the ‘buzzy-ness’ of the term learning analytics just now (more on that in the vendor section of this post) – and is not meant in any way as a critisism of the conference or the quality of the papers, both of which were excellent. On reflection I think that the pre-conference workshops gave more of an opportunity for discuss than the traditional paper presentation with short Q&A format which the conference followed. Perhaps for LAK13 a mix of presentation formats might be included. With any domain which hopes to impact on teaching and learning there are difficulties breaching the research and practice divide and personally I find workshops give more opportunity for discussion. That said, I did see a lot of interesting presentations which did have potential, including a reintroduction to SNAPP which Lori Lockyer and Shane Dawson presented at the Learning Analytics meets Learning Design workshop; a number of very interesting presentations from the OU on various aspects of their work in research and now applying analytics; the Mirror project, an EU funded work based learning project which includes a range of digital, physical and emotional analytics and the GLASS system presented by Derek Leony, Carlos III, Madrid to name just a few.

George Seimens presented his vision(s) for the domain in his keynote (this was the first keynote I have seen where the presenter’s ideas were shared openly during the presentation – such a great example of openness in practice). There was also an informative panel session around the differences and potential synergies with the Educational Data Mining community. SOLAR (the society for learning analytics research ) is planning a series of events to continue these discussions and scoping of the domain, and we at CETIS will be involved in helping with a UK event later this year.

Vendors
There were lots of vendors around. I didn’t get any impression of any kind of hard sell, but every educational tool be it LMS/VLE/CMS now has a very large, shiny new analytics badge on it – even if what is being offered is actually the same as before, but just with parts re-labelled. I’m not sure how much (or any) of the forward thinking research that was presented will filter down into large scale tools, but I guess that’s an answer in itself for the need for the research in this area. So we in the education community can be informed and ask questions challenging the vendors and the systems they present. I was impressed with a (new to me) system called canvas analytics which colleagues from the community college sector in Washington State briefly showed me. It seems to allow flexibility and customisation of features and UI, is cloud based and so has a more distributed architecture, has CC licensing built in, and a crowd sourced feature request facility.

With so many potential sources of data it is crucial that systems are flexible and can pull and push data out to a variety of end points. This allows users – both at the institutional back end and the UI end – flexibility over what they use. CETIS have been supporting JISC to explore notions of flexible provision through a number of programmes including DVLE.

Lori Lockyer made an timely reflection on the development of learning design drawing parallels with the learning analytics. This made me immediately think of the slight misnomer of learning design, which in many cases was actually more about teaching design. With learning analytics there are similar parallels but what also crossed my mind on more than one occasion was the notion of marketing analytics as a key driver in this space. This was probably more noticeable due to the North American slant of the conference. But I was once again struck by the differences in approaches to marketing of students in North America and the UK. Universities and colleges in the US have relatively huge marketing budgets compared to us, they need to get students into their classes and keep them there. Having a system or integrated systems which manage retention numbers, and if you like the more business intelligence end of the analytics spectrum, could gain traction far more quickly than ones that are exploring the much harder to qualify effective learning analytics. Could this lead us into a similar situation with VLEs/LMSs where there was a perceived need to have one (“everyone else has got one”), vendors sold the sector something which kind of looked like it did the job? Given my comments earlier about flexibility and pervasiveness of web services, I hope not, but some dark thoughts did cross my mind and I was drawn back to Gardner Campbell’s presentation questioning some of the narrow definitions of learning analytics.

Assessment
It’s still the bottom line, and the key driver for most educational systems, and in turn analytics about those systems. Improving assessment numbers gets senior management attention. The Signals project at Purdue is one of the leading lights in the domain of learning analytics, and John Campbell and the team there have, and continue to do an excellent job of gathering data from mainly their LMS and feed it back to students in ways that do have an impact. But again, going back to Gardner Campbell’s presentation, learning analytics as a research domain is not just about assessment. So, I was heartened to see lots of references to the potential for analytics to be used in terms of measuring competencies, which I think could have potential for students as it might help to contextualise existing and newly developed/ing competencies, and allow some more flexible approaches to recognition of competencies to be developed. More opportunities to explore the context of learning and not just sell the content? Again, relating back the role of vendors, I was reminded of how content driven the North American systems is. Vendors are increasingly offering competitive alternatives for elective courses with accreditation, as well as OERs (and of course collecting the data). In terms of wider systems, I’m sure that an end to end analytics system with content and assessment all bundled in is not that far off being offered, if it isn’t already.

Ethics
Data and ethics, collect one and ignore the other at your peril! My first workshop was one run by Sharon Slade and Finella Gaphin from the OU and I have to say, I think it was a great start to the whole week (not just because we got to play snakes and ladders) as ethics and our approaches to them underline all the activity in this area. Most attention just now is focusing on issues of privacy, but there are a host of other issues including:
*power – who gets to decided what is done with the data?
*rights – does everyone have the same rights to use data? who can mine data for other purposes?
*ownership – do students own their data – what are the consequences of opt outs?
*responsibility – is there shared responsibility between institutions and students?

Doug Clow live blogged the workshop if you want more detailed information, and it is hoped that a basis for a code of conduct can be developed from the session.

Students
Last, but certainly not least, students. The student voice was at times deafening by its silence. At several points during the conference, particularly during the panel session on Building Organisational Capacity by Linda Baer and Dan Norris, I felt a growing concern about things being done “to” and not “with” students. Linda and Dan are conducting some insightful research into organisational capacity building and have already interviewed many (North American) institutions and vendors but there was very little mention of students. If learning analytics are going to really impact on learning and help transform pedagogical approaches, then shouldn’t we be talking about them to the students? What does really work for them? Are they aware of what data is being collected about them? Are they willing to let more data from informal sources e.g. Facebook, 4square etc be used in the context of learning analytics? Are they aware of their data exhaust? As well as these issues, Simon Buckingham-Schum made the very pertinent point, that if students were given access to their data, would they actually be able to do anything with it?

And also if we are collecting data about students shouldn’t we be also collecting similar data about teaching staff?

I don’t want to add yet another literacy to the seemingly never ending list, but this does tie in with the wider context of digital literacy development. Sense making of data and visualisations is key if learning analytics is to gain traction in practice, and it’s not just students who are falling short, it’s probably all of us. I saw lots of “pretty pictures” in terms of network visualisations, potential dashboard views, etc over the week – but did I really understand them? Do I have the necessary skills to properly de-code and make sense of them? Sometimes, but not all the time. I think visualisations should come with a big question mark symbol attached or overlaid – they should always raise questions. at the moment I don’t think enough people have the skills to be able to confidently question them.

Overall it was a very thought provoking week, with too much to included in one post but if you have a chance take a look at Katy Borner’s keynote Visual Analytics in Support of Education one of my highlights.

So, thanks to all the organisers for creating such a great atmosphere for sharing and learning. I’m looking forward to LAK13 and what advances will be made in the coming year and if a European location will bring some a different slant to the conference.