Cetis Analytics Series Volume 2: Engaging with Analytics

Our first set of papers around analytics in education has been published, and with nearly 17,000 downloads, it would seem that there is an appetite for resources around this topic. We are now moving onto phase of our exploration of analytics and accompanying this will be a range of outputs including some more briefing papers and case studies. Volume 1 took a high level view of the domain, volume 2 will take a much more user centred view including a number of short case studies sharing experiences of a range of early adopters who are exploring the potential of taking a more analytics based approach.

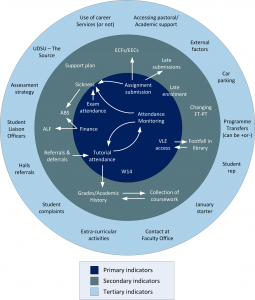
The first case study features Jean Mutton, Student Experience Project Manager, at the University of Derby. Jean shares with us how her journey into the world of analytics started and how and where she and the colleagues across the university she has been working with, see the potential for analytics to have an impact on improving the student experience.

University of Derby, student engagement factors

University of Derby, student engagement factors

The case study is available to download here.

We have a number of other case studies identified which we’ll be publishing over the coming months, however we are always looking for more examples. So if you are working with analytics have some time to chat with us, we’d love to hear from you and share your experiences in this way too. Just leave a comment or email me (s.macneill@strath.ac.uk).

What can I do with my educational data? (#lak13)

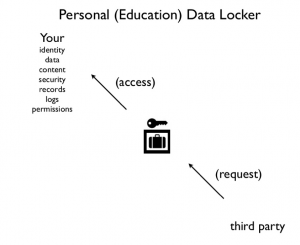
Following on from yesterday’s post, another “thought bomb” that has been running around my brain is something far closer to the core of Audrey’s “who owns your educational data?” presentation. Audrey was advocating the need for student owned personal data lockers (see screen shot below). This idea also chimes with the work of the Tin Can API project, and closer to home in the UK the MiData project. The latter is more concerned with more generic data around utility, mobile phone usage than educational data, but the data locker concept is key there too.

Screen shot of Personal Education Data Locker (Audrey Watters)

Screen shot of Personal Education Data Locker (Audrey Watters)

As you will know dear reader, I have turned into something of a MOOC-aholic of late. I am becoming increasingly interested in how I can make sense of my data, network connections in and across the courses I’m participating in and, of course, how I can access and use the data I’m creating in and across these “open” courses.

I’m currently not very active member of the current LAK13 learning analytics MOOC, but the first activity for the course is, I hope, going to help me frame some of the issues I’ve been thinking about in relation to my educational data and in turn my personal learning analytics.

Using the framework for the first assignment/task for LAK13, this is what I am going to try and do.

1. What do you want to do/understand better/solve?

I want to compare what data about my learning activity I can access across 3 different MOOC courses and the online spaces I have interacted in on each and see if I can identify any potentially meaningful patterns, networks which would help me reflective and understand better, my learning experiences. I also want to explore see how/if learning analytics approaches could help me in terms of contributing to my personal learning environment (PLE) in relation to MOOCs, and if it is possible to illustrate the different “success” measures from each course provider in a coherent way.

2. Defining the context: what is it that you want to solve or do? Who are the people that are involved? What are social implications? Cultural?

I want to see how/if I can aggregate my data from several MOOCs in a coherent open space and see what learning analytics approaches can be of help to a learner in terms of contextualising their educational experiences across a range of platforms.

This is mainly an experiment using myself and my data. I’m hoping that it might start to raise issues from the learner’s perspective which could have implications for course design, access to data, and thoughts around student created and owned eportfolios/and or data lockers.

3. Brainstorm ideas/challenges around your problem/opportunity. How could you solve it? What are the most important variables?

I’ve already done some initial brain storming around using SNA techniques to visualise networks and connections in the Cloudworks site which the OLDS MOOC uses. Tony Hirst has (as ever) pointed the way to some further exploration. And I’ll be following up on Martin Hawksey’s recent post about discussion group data collection .

I’m not entirely sure about the most important variables just now, but one challenge I see is actually finding myself/my data in a potentially huge data set and finding useful ways to contextualise me using those data sets.

4. Explore potential data sources. Will you have problems accessing the data? What is the shape of the data (reasonably clean? or a mess of log files that span different systems and will require time and effort to clean/integrate?) Will the data be sufficient in scope to address the problem/opportunity that you are investigating?

The main issue I see just now is going to be collecting data but I believe there some data that I can access about each MOOC. The MOOCs I have in mind are primarily #edc (coursera) and #oldsmooc (OU). One seems to be far more open in terms of potential data access points than the other.

There will be some cleaning of data required but I’m hoping I can “stand on the shoulders of giants” and re-use some google spreadsheet goodness from Martin.

I’m fairly confident that there will be enough data for me to at least understand the problems around the challenges for letting learners try and make sense of their data more.

5. Consider the aspects of the problem/opportunity that are beyond the scope of analytics. How will your analytics model respond to these analytics blind spots?

This project is far wider than just analytics as it will hopefully help me to make some more sense of the potential for analytics to help me as a learner make sense and share my learning experiences in one place that I chose. Already I see Coursera for example trying to model my interactions on their courses into a space they have designed – and I don’t really like that.

I’m thinking much more about personal aggregation points/ sources than the creation of actual data locker. However it maybe that some existing eportfolio systems could provide the basis for that.

As ever I’d welcome any feedback/suggestions.

Whose data is it anyway?

I’ve just caught up with the recent #etmooc webinar featuring Audrey Watters titled ‘who owns your education data?’. At the start of her talk Audrey said she wanted to plant some “thought bombs” for participants. I’m not sure this post is particularly explosive, but her talk has prompted me to try and share some thoughts which have been mulling around my brain for a while now.

Audrey’s talk centred around the personal data, and asked some very pertinent questions in relation to educational data; as well as the more general “data giveaway” we are all a part of when we all too quickly sign terms and conditions for various services. Like most people I’ve never actually read all the terms and conditions of anything I’ve signed up for online.

Over the last year or so, I’ve been increasingly thinking about data and analtyics (not just learning analytics) in education in general. And I keep coming back to the fundamental questions Audrey raises in the presentation around the who, what, why, where, when and how of data collection, access and (re)use. Audrey focuses on the issue from the individual point of view, and I won’t try and repeat her presentation, I would recommend you take half an hour to listen to it. One thought bomb that is ticking in my head is about data collection and use at the institutional level.

As more and more systems offer analytics packages, and in particular learning analytics solutions, are we sure that at an institutional we can get the data from the systems, when we want it and in a format we want it and not just be given data reports/and or dashboards? At these relatively early stages for learning analtyics, are institutions in danger of unwittingly giving away their data to companies who have solutions which suit today’s needs without thinking about future requirements for access to/and use of data? There is a recognised skills shortage of data scientists (not just in education) so at the moment it is often easier to buy an off the shelf solution. As we all become more data aware and (hopefully) data literate, our demands for access to data and our abilities to do something useful with it should develop too.

This is an issue John Campbell (Purdue University) raised at his presentation at the Surfnet Conference last November. We had several conversations about the potential for turning some of the terms and conditions for data on its head by having having some (community created and shared) clause which system vendors would have to agree to. Something along the lines of “if we use your tool, we have the right to right to request all data being collected for return to the institution on a timely basis in a format of our choice”. I can see a clause like that being useful at at personal level too.

Wherever we sit we need to continually use the fundamental questions around who, what, why, where, when and how of our data collection systems, policies and strategies to negotiate appropriate access.

Prototyping my Cloudworks profile page

Week 5 in #oldsmooc has been all about prototyping. Now I’ve not quite got to the stage of having a design to prototype so I’ve gone back to some of my earlier thoughts around the potential for Cloudworks to be more useful to learners and show alternative views of community, content and activities. I really think that Cloudworks has potential as a kind of portfolio/personal working space particularly for MOOCs.

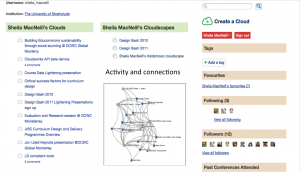
As I’ve already said, Cloudworks doesn’t have a hierarchical structure, it’s been designed to be more social and flexible so its navigation is somewhat tricky, particularly if you are using it over a longer time frame than say a one or two day workshop. It relies on you as a user to tag and favourite clouds and cloudscapes, but even then when you’re involved in something like a mooc that doesn’t really help you navigate your way around the site. However cloudworks does have an open API and as I’ve demonstrated you can relatively easily produce a mind map view of your clouds which makes it a bit easier to see your “stuff”. And Tony Hirst has shown how using the API you can start to use visualisation techniques to show network veiws of various kinds.

In a previous post I created a very rough sketch of how some of Tony’s ideas could be incorporated in to a user’s profile page.

Potential Cloudworks Profile page

Potential Cloudworks Profile page

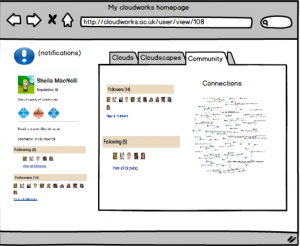
As part of the prototyping activity I decide to think a bit more about this and use Balsamiq (one of the tools recommended to us this week) to rough out some ideas in a bit more detail.

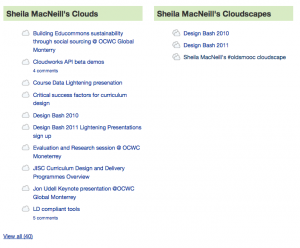
The main ideas I had were around redesigning the profile page so it was a bit more useful. Notifications would be really useful so you could clearly see if anything had been added to any of your clouds or clouds you follow – a bit like Facebook. Also one thing that does annoy me is the order of the list of my clouds and cloudscapes – it’s alphabetical. But what I really want at the top of the list is either my most recently created or most active cloud.

In the screenshot below you can see I have an extra click and scroll to get to my most recent cloud via the clouds list. What I tend to do is a bit of circumnavigation via my oldsmooc cloudscape and hope I have add my clouds it it.

Screen shot of my cloud and cloudscape lists

Screen shot of my cloud and cloudscape lists

I think the profile page could be redesigned to make use of the space a bit more (perhaps lose the cloud stream, because I’m not sure if that is really useful or not as it stands), and have some more useful/useble views of my activity. The three main areas I thought we could start grouping are clouds, cloudscapes (and they are already included) and add a community dimension so you can start to see who you are connecting with.

My first attempt:

screen shot of my first Cloudworks mock up

screen shot of my first Cloudworks mock up

Now but on reflection – tabs not a great idea and to be honest they were in the tutorial so I that’s probably why I used them :-)

But then I had another go and came up something slightly different. Here is a video where I explain my thinking a bit more.

cloudworks profile page prototype take 2 from Sheila MacNeill on Vimeo.

Some initial comments from fellow #oldsmooc-ers included:

and you can see more comments in my cloud for the week as well as take 1 of the video.

This all needs a bit more thought – particularly around what is actually feasible in terms of performance and creating “live” visualisations, and indeed about what would actually be most useful. And I’ve already been in conversation with Juliette Culver the original developer of Cloudworks about some of the more straight forward potential changes like the re-ordering of cloud lists. I do think that with a bit more development along these lines Cloudworks could become a very important part of a personal learning environment/portfolio.

Ghosts in the machine? #edcmooc

Following on from last week’s post on the #edcmooc, the course itself has turned to explore the notion of MOOCs in the context of utopian/dystopian views of technology and education. The questions I raised in the post are still running through my mind. However they were at a much more holistic than personal level.

This week, I’ve been really trying to think about things from my student (or learner) point of view. Are MOOCs really changing the way I engage with formal education systems? On the one hand yes, as they are allowing me (and thousands of others) to get a taste of courses from well established institutions. At a very surface level who doesn’t want to say they’ve studied at MIT/Stanford/Edinburgh? As I said last week, there’s no fee so less pressure in one sense to explore new areas and if they don’t suit you, there’s no issue in dropping out – well not for the student at this stage anyway. Perhaps in the future, through various analytical methods, serial drop outs will be recognised by “the system” and not be allowed to join courses, or have to start paying to be allowed in.

But on the other hand, is what I’m actually doing really different than what I did at school and when I was an undergraduate or was a student on “traditional’ on line, distance courses. Well no, not really. I’m reading selected papers and articles, watching videos, contributing to discussion forums – nothing I’ve not done before, or presented to me in a way that I’ve not seen before. The “go to class” button on the Coursera site does make me giggle tho’ as it’s just soo American and every time I see it I hear a disembodied American voice. But I digress.

The element of peer review for the final assignment for #edcmooc is something I’ve not done as a student, but it’s not a new concept to me. Despite more information on the site and from the team this week I’m still not sure how this will actually work, and if I’ll get my certificate of completion for just posting something online or if there is a minimum number of reviews I need to get. Like many other fellow students the final assessment is something we have been concerned about from day 1, which seemed to come as a surprise to some of the course team. During the end of week 1 google hang out, the team did try to reassure people, but surely they must have expected that we were going to go look at week 5 and “final assessment” almost before anything else? Students are very pragmatic, if there’s an assessment we want to know as soon as possible the where,when, what, why, who,how, as soon as possible. That’s how we’ve been trained (and I use that word very deliberately). Like thousands of others, my whole education career from primary school onwards centred around final grades and exams – so I want to know as much as I can so I know what to do so I can pass and get that certificate.

That overriding response to any kind of assessment can very easily over-ride any of the other softer (but just as worthy) reasons for participation and over-ride the potential of social media to connect and share on an unprecedented level.

As I’ve been reading and watching more dystopian than utopian material, and observing the general MOOC debate taking another turn with the pulling of the Georgia Tech course, I’ve been thinking a lot of the whole experimental nature of MOOCs. We are all just part of a huge experiment just now, students and course teams alike. But we’re not putting very many new elements into the mix, and our pre-determined behaviours are driving our activity. We are in a sense all just ghosts in the machine. When we do try and do something different then participation can drop dramatically. I know that I, and lots of my fellow students on #oldsmooc have struggled to actually complete project based activities.

The community element of MOOCs can be fascinating, and the use of social network analysis can help to give some insights into activity, patterns of behaviour and connections. But with so many people on a course is it really possible to make and sustain meaningful connections? From a selfish point of view, having my blog picked up by the #edcmooc news feed has greatly increased my readership and more importantly I’m getting comments which is more meaningful to me than hits. I’ve tried read other posts too, but in the first week it was really difficult to keep up, so I’ve fallen back to a very pragmatic, reciprocal approach. But with so much going on you need to have strategies to cope, and there is quite a bit of activity around developing a MOOC survival kit which has come from fellow students.

As the course develops the initial euphoria and social web activity may well be slowing down. Looking at the twitter activity it does look like it is on a downwards trend.
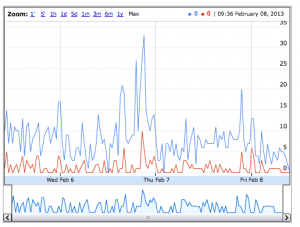
#edcmooc Twitter activity diagram

#edcmooc Twitter activity diagram

Monitoring this level of activity is still a challenge for the course team and students alike. This morning my colleague Martin Hawskey and I were talking about this, and speculating that maybe there are valuable lessons we in the education sector can learn from the commercial sector about managing “massive” online campaigns. Martin has also done a huge amount of work aggregating data and I’d recommend looking at his blogs. This post is a good starting point.

Listening to the google hang out session run by the #edcmooc team they again seemed to have under estimated the time sink reality of having 41,000 students in a course. Despite being upfront about not being everywhere, the temptation to look must be overwhelming. This was also echoed in the first couple of weeks of #oldsmooc. Interestingly this week there are teaching assistants and students from the MSc course actively involved in the #edcmooc.

I’ve also been having a play with the data from the Facebook group. I’ve had a bit of interaction there, but not a lot. So despite it being a huge group I don’t get the impression, that apart from posting links to blogs for newsfeed, there is a lot of activity or connections. Which seems to be reflected in the graphs created from the data.
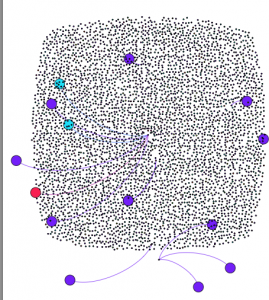
#edc Facebook group friends connections

#edc Facebook group friends connections


This is a view based on friends connections. NB it was very difficult for a data novice like me to get any meaningful view of this group, but I hope that this gives the impression of the massive number of people and relative lack of connections.

There are a few more connections which can be drawn from the interactions data, and my colleagye David Sherlock manage create a view where some clusters are emerging – but with such a huge group it is difficult to read that much into the visualisation – apart from the fact that there are lots of nodes (people).
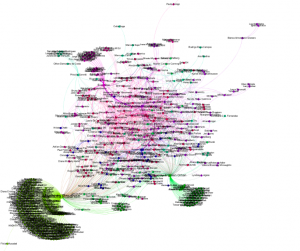
#edcmooc Facebook group interactions

#edcmooc Facebook group interactions


I don’t think any of this is unique to #edcmooc. We’re all just learning how to design/run and participate at this level. Technology is allowing us to connect and share at a scale unimaginable even 10 years ago, if we have access to it. NB there was a very interesting comment on my blog about us all being digital slaves.

Despite the potential affordances of access at scale it seems to me we are increasingly just perpetuating an existing system if we don’t take more time to understand the context and consequences of our online connections and communities. I don’t need to connect with 40,000 people but I do want to understand more about how, why and how I could/do. That would be a really new element to add to any course, not just MOOCs (and not something that’s just left to a course specifically about analytics). Unless that happens my primary driver will be that “completion certificate”. In this instance, and many others, to get that I don’t really need to make use of the course community. So I’m just perpetuating an existing where I know how to play the game, even if it’s appearance is somewhat disguised.
Quick review of the Larnaca Learning Design Declaration

Late last month the Larnaca Declaration on Learning Design was published. Being “that time of year” I didn’t get round to blogging about it at the time. However as it’s the new year and as the OLDS mooc is starting this week, I thought it would be timely to have a quick review of the declaration.

The wordle gives a flavour of the emphasis of the text.

Wordle of Larnaca Declaration on Learning Design

Wordle of Larnaca Declaration on Learning Design

First off, it’s actually more of a descriptive paper on the development of research into learning design, rather than a set of statements declaring intent or a call for action. As such, it is quite a substantial document. Setting the context and sharing the outcomes of over 10 years worth of research is very useful and for anyone interested in this area I would say it is definitely worth taking the time to read it. And even for an “old hand” like me it was useful to recap on some of the background and core concepts. It states:

“This paper describes how ongoing work to develop a descriptive language for teaching and learning activities (often including the use of technology) is changing the way educators think about planning and facilitating educational activities. The ultimate goal of Learning Design is to convey great teaching ideas among educators in order to improve student learning.”

One of my main areas of involvement with learning design has been around interoperability, and the sharing of designs. Although the IMS Learning Design specification offered great promise of technical interoperability, there were a number of barriers to implementation of the full potential of the specification. And indeed expectations of what the spec actually did were somewhat over-inflated. Something I reflected on way back in 2009. However sharing of design practice and designs themselves has developed and this is something at CETIS we’ve tried to promote and move forward through our work in the JISC Design for Learning Programme, in particular with our mapping of designs report, the JISC Curriculum Design and Delivery Programmes and in our Design bashes: 2009, 2010, 2011. I was very pleased to see the Design Bashes included in the timeline of developments in the paper.

James Dalziel and the LAMS team have continually shown how designs can be easily built, run, shared and adapted. However having one language or notation system is a still goal in the field. During the past few years tho, much of the work has been concentrated on understanding the design process and how to help teachers find effective tools (online and offline) to develop new(er) approaches to teaching practice, and share those with the wider community. Viewpoints, LDSE and the OULDI projects are all good examples of this work.

The declaration uses the analogy of the development of musical notation to explain the need and aspirations of a design language which can be used to share and reproduce ideas, or in this case lessons. Whilst still a conceptual idea, this maybe one of the closest analogies with universal understanding. Developing such a notation system, is still a challenge as the paper highlights.

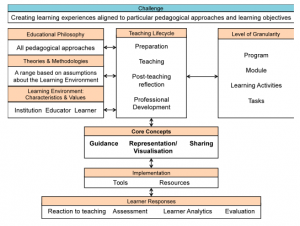
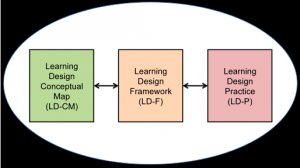
The declaration also introduces a Learning Design Conceptual Map which tries to “capture the broader education landscape and how it relates to the core concepts of Learning Design“.

Learning Design Conceptual Map

Learning Design Conceptual Map

These concepts including pedagogic neutrality, pedagogic approaches/theories and methodologies, teaching lifecycle, granularity of designs, guidance and sharing. The paper puts forward these core concepts as providing the foundations of a framework for learning design which combined with the conceptual map and actual practice provides a “new synthesis for for the field of learning design” and future developments.

Components of the field of Learning Design

Components of the field of Learning Design

So what next? The link between learning analytics and learning design was highlighted at the recent UK SoLAR Flare meeting. Will having more data about interaction/networks be able to help develop design processes and ultimately improving the learning experience for students? What about the link with OERs? Content always needs context and using OERs effectively intrinsically means having effective learning designs, so maybe now is a good time for OER community to engage more with the learning design community.

The Declaration is a very useful summary of where the Learning Design community is to date, but what is always needed is more time for practising teachers to engage with these ideas to allow them to start engaging with the research community and the tools and methodologies which they have been developing. The Declaration alone cannot do this, but it might act as a stimulus for exisiting and future developments. I’d also be up for running another Design Bash if there is enough interest – let me know in the comments if you are interested.

The OLDS MOOC is a another great opportunity for future development too and I’m looking forward to engaging with it over the next few weeks.

Some other useful resources
*Learning Design Network Facebook page
*PDF version of the Declaration
*CETIS resources on curriculum and learning design
*JISC Design Studio

Institutional Readiness for Analytics – practice and policy

So far in our Analytics Series we have been setting out the background, history and context of analytics in education at fairly broad and high levels. Developing policy and getting strategic buy-in is critical for any successful project (analytics based or not), so we have tried to highlight issues which will be of use to senior management in terms of the broader context and value of analytics approaches.

Simon Buckingham Schum at the OU (a key figure in the world of learning analytics) has also just produced Learning Analytics Policy Brief for the UNESCO Institute for Information Technologies in Education. Specifically focussing on learning analytics Simon’s paper highlights a number of key issues around “the limits of computational modelling, the ethics of analytics, and the educational paradigms that learning analytics promote”, and is another welcome addition to the growing literature on learning analytics; and is a useful complementary resource to to the CETIS series. I would recommend it to anyone interested in this area.

Moving from the policy to practicalities is the focus of our next paper, Institutional Readiness for Analytics. Written by Stephen Powell (with a little bit of input from me), this paper drills down from policy level decisions to the more pragmatic issues faced by staff in institutions who want to start to make some sense of their data through analytics based techniques. It presents two short cases studies (from the University of Bolton and the Open University) outlining the different approaches each institution has taken to try and make more sense of the data they have access to and how that can begin to make an impact on key decisions around teaching, learning and administrative processes.

The OU is probably slightly “ahead of the game” in terms of data collection and provisioning and so their case study focuses more on staff development issues through their Data Wrangler Project, whereas the University of Bolton case study looks more at how they are approaching data provisioning issues. As the paper states, although the two approaches are very different “they should be considered as interrelated with each informing the work of the other in a process of experimentation leading to the development of practices and techniques that meet the needs of the organisation.”

As ever if you have thoughts or any experiences of using analytics approaches in your institution, we’d love to hear from you in the comments.

The paper is available for download here, and the other papers in the series from are available here.

UK SoLAR meeting feedback

Last month in collaboration with the colleagues at the OU we co-hosted the inaugural UK SoLAR Flare. A number of blogs, pictures and videos of the day are available on the SoLAR website.

This was the first meeting in the UK focusing on learning analytics and as such we had quite a broad cross section of attendees. We’ve issued a small survey to get some feedback from delegates, and many thanks to all the attendees who completed it. We had 20 responses in total and you can access collated results of the survey from here.

Overall, 100% of respondents found the day either very useful or useful, which is always a good sign, and bodes well for the beginnings of a new community of practice and future meetings

The need for staff development and a range of new skills is something that is being increasingly identified for successful analytics projects and is an underlying theme our current Analtyics Series. The role of the Data Scientist is being increasingly recognised as a key role both in the “real” world and in academia. So what roles did our attendees have? Well, we did have one data scientist, but perhaps not that surprisingly the most common role was that of Learning Technologist with 5 people. The full results were as follows:

learning technologist 5
manager 3
lecturer 3
developer 3
researcher 3
data scientist 1
other 2
(other answers; “director/agile manager” “sort of learning technologist but also training”

So a fair spread of roles which again bodes well for the development of teams with the skill needed to develop successful analytics projects.

We also asked attendees to share the main idea that they took away from the day. Below is a selection of responses.

“That people are in the early stages of discussion.”

“Learning analytics needs to reach out end-users”

“The overall idea was how many people are in the same position and that the field is in a very experimental stage. This improves the motivation to be experimental.”

“more a better understanding of the current status than a particular idea. But if I had to chose one idea it is the importance of engaging students in the process.”

“Early thoughts on how learning analytics could be used in the development of teaching staff.”

“That HE is on the cusp of something very exciting and possibly very enlightening regarding understanding the way students learn. BUT the institution as a whole needs to be commited to the process, and that meaningful analysis of the mass of potential data that is ‘out there’, is going to be critical. There is also the very important issues of ethics and who is going to do what with the data………I could go on, and on, and on…….”

Suggestions for further meetings included:

“It would be great to involve more academic teaching staff and students in future meetings.”

“I think bringing together the different stakeholders (technologists, teachers, students, data scientists, statisticians) is a great feature for this group. It is easy to break into silos and forget the real end-user. Having more students involved would be great.”

“An international project exchange. Have, say, 10 – 15 lightning talks. Then organise a poster session with posters corresponding to the lightning talks. People whose interest was drawn by one project or another will have the chance to follow up on that project for further information. Also maybe an expert panel (with people that have experience with putting learning analytics into educational practice) that can answer questions sent in beforehand by people wanting to set up a learning analytics project/activity. This can also be done Virtually”

“Would really welcome the opportunity to have a ‘hands on’ session possibly focussing upon the various dashboards that are out there.”

You can access the full results at the SoLAR website.

Analytics for Understanding Research

After a bit of exploration of the history, meanings and definitions of analytics from Adam Cooper, today our Analytics Series continues with the Analytics for Understanding Research paper (by Mark Van Harmelen).

Research and research management are key concerns for Higher Education, and indeed the wider economy. The sector needs to to ensure it is developing, managing, and sharing research capacity, capabilities, reputation and impact as effectively and efficiently as possible.

The use of analytics platforms has the potential to impact all aspects of research practice from the individual researcher in sharing and measuring their performance, to institutional management and planning of research projects, to funders in terms of decision making about funding areas.

The “Analytics for Understanding Research” paper focuses on analytics as applied to “the process of research, to research results and to the measurement of research.” The paper highlights exemplar systems, metrics and analytic techniques backed by evidence in academic research, the challenges in using them and future directions for research. It points to the need for the support and development of high quality, timely data for researchers to experiment with in terms of measuring and sharing their reputation and impact, and the wider adoption of platforms which utilise publicly available (and funded) data to inform and justify research investment.

Some key risks involved in the use of analytics to understand research highlighted in the paper are:

*Use of bibliometric indicators as the sole measure of research impact or over-reliance on metrics without any understanding of the context and nature of the research.
*Lack of understanding of analytics and advantages and disadvantages of different indicators on the part of users of those indicators. Managers and decision makers may lack the background needed to interpret existing analytics sensitively.
*The suitability of target-based assessment based on analytics is unproven. A wider assessment approach was tentatively recommended above (in most detail on page 29).
*There is a danger of one or a few vendors supplying systems that impose a particular view of analytics on research management data.

However it also points to some key opportunities including:

*Access to high-quality timely analytics may enable professionals to gauge their short-term performance, and use experimentation to discover new and novel ways to boost their impact.
*Adoption of CERIF-based CRIS across UK HE institutions and research institutes, with automatic retrieval of public data by UK Research Councils may help motivate increases in public funding of scientific and other scholarly activity; vitally important to the UK economy and national economic growth.
*Training as to the advantages, limitations and applicability of analytics may assist in the effective use of analytics its lay users, including researchers, research managers, and those responsible for policy and direction in institutions and beyond.

As ever, if you have any thoughts or experiences you’d like to share, please do so in the comments.

The paper is available to download here .

The papers published to date in the series are all available here.

Legal, Risk and Ethical Aspects of Analytics in Education

After some initial feedback on the CETIS Analytics Series, we’ve had a wee re-think of our publication schedule and today we launch the “Legal, Risk and Ethcial Aspects of Analytics in Education” written by David Kay (Sero Consulting), Naomi Korn and Professor Charles Oppenheim.

As all researchers are only too well aware, any practice involving data collection and reuse has inherent ethical and legal implications of which institutions must be cognisant. Most institutions have guidelines and policies in place for the collection and use of research data in place. However, the gathering of usage data primarily from internal systems, is an area where it is less commonplace for institutions to have legal and ethical guidelines in place. As with a number of developments in technology, current laws have not developed at a similar pace.

The “Legal, Risk and Ethical Aspects of Analytics in Higher Education” paper provides a concise overview of legal and ethical concerns in relation to analytics in education. It outlines a number of legal actors which impinge on analytics for education, in particular:

* Data Protection
* Confidentiality & Consent
* Freedom of Information
* Intellectual Property Rights
* Licensing for Reuse.

The paper also recommends a set of common principles which have universal application.

*Clarity; open definition of purpose, scope and boundaries, even if that is broad and in some respects extent open-ended,

*Comfort & care; consideration for both the interests and the feelings of the data subject and vigilance regarding exceptional cases,

*Choice & consent; informed individual opportunity to opt-out or opt-in,

*Consequence & complaint; recognition that there may be unforeseen consequences and therefore provision of mechanisms for redress.

Being aware of the legal and ethical implications of any activity requiring data collection is fundamental before undertaking any form of data analysis activity, and we hope this paper will be of use in helping inform and develop practice. As ever, if you have any comments/ examples please use the comments section to share them with us.

The paper is available to download here.

The papers published so far in the series are:

*Analytics, What is Changing and Why does it Matter?
*Analytics for the Whole Institution; Balancing Strategy and Tactics
*Analytics for Learning and Teaching