Timeline of an event

As readers of this blog will know, I quite like experimenting with a number of services to record, represent and re-present various activities. One tool I have been revisiting over the past few months is memolane. When I first looked at this service I thought it had potential for projects and also as a kind of corporate memory. I’ve now started to use its “story” feature to record tweets and blogs from a number of meetings and conferences e.g. e-Assessment Scotland, EuroSakai, and I’ve just pulled together my blogs and tweets from the recent Design Bash 11 meeting – see embedded story below. Clicking on the blog posts expands them so you can read the whole text, and you can move along the timeline using the arrows on top right hand side of the frame.

I think this gives a really nice overview of my pre, during and post meeting activity. I’d be interested in hearing how useful others think of this view of an event.

Betweenness Centrality – helping us understand our networks

Like many others I’m becoming increasingly interested in the many ways we can now start to surface and visualise connections on social networks. I’ve written about some aspects social connections and measurement of networks before.

My primary interest in this area just now is more at the CETIS ISC (innovation support centre) level, and to explore ways which we can utilise technology better to surface our networks, connections and influence. To this end I’m an avid reader of Tony Hirst’s blog, and really appreciated being able to attend the recent Metrics and Social Web Services workshop organised by Brian Kelly and colleagues at UKOLN to explore this topic more.

Yesterday, promoted by a tweet of a visualisation of the twitter community at the recent eAssessment Scotland conference, the phrase “betweenness centrality” came up. If you are like me, you may well be asking yourself “what on earth is that?” And thanks to the joy of twitter this little story provides an explanation (the zombie reference at the end should clarify everything too!)

View “Betweenness centrality – explained via twitter” on Storify

In terms of CETIS, being able to illustrate aspects of our betweenness centrality is increasingly important. Like others involved in innovation and community support, it is often difficult to qualify and quantify impact and reach, and we often have to rely on anecdotal evidence. On a personal level, I do feel my own “reach” an connectedness has been greatly enhanced via social networks. And through various social analysis tools such as Klout, Peer Index and SocialBro I am now gaining a greater understand of my network interactions. At the CETIS level however we have some other factors at work.

As I’ve said before, our social media strategy has raised more through default that design with twitter being our main “corporate” use. We don’t have a CETIS presence on the other usual suspects Facebook, Linkedin , Google+. We’re not in the business of developing any kind of formal social media marketing strategy. Rather we want to enhance our existing network, let our community know about our events, blog posts and publications. At the moment twitter seems to be the most effective tool to do that.

Our @jisccetis twitter account has a very “lite” touch. It primarily pushes out notifications of blog posts and events, we don’t follow anyone back. Again this is more by accident by design, but this has resulted in a very “clean” twitter stream. On a more serious note, our main connections are built and sustained through our staff and their personal interactions (both online and offline). However, even with this limited use of twitter (and I should point out here that not all CETIS staff use twitter) Tony has been able to produce some visualisations which start to show the connections between followers of the @jisccetis account and their connections. The network visualisation below shows a view of those connections sized by betweenness centrality.
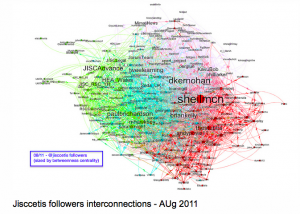
@jisccetis twitter followers betweenness centrality

So using this notion of betweenness centrality we can start to see, understand and identify some key connections, people and networks. Going back to the twitter conversation, Wilbert pointed out ” . . . innovation tends to be spread by people who are peripheral in communities”. I think this is a key point for an Innovation Support Centre. We don’t need to be heavily involved in communities to have an impact, but we need to be able to make the right connections. One example of this type of network activity is illustrated through our involvement in standards bodies. We’re not at always at the heart of developments but we know how and where to make the most appropriate connections at the most appropriate times. It is also increasingly important that we are able to illustrate and explain these types of connections to our funders, as well as allowing us to gain greater understanding of where we make connections, and any gaps or potential for new connections.

As the conversation developed we also spoke about the opportunities to start show the connections between JISC funded projects. Where/what are the betweenness centralities across the e-Learning programme for example? What projects, technologies and methodologies are cross cutting? How can the data we hold in our PROD project database help with this? Do we need to do some semantic analysis of project descriptions? But I think that’s for another post.

Socially favoured projects, real measures of engagement?

Martin Hawksey has been doing a bit of playing around with JISC project data lately and has now created a spreadsheet of the top “socially favoured” JISC funded projects.

As a large part of my job involves supporting and amplifying the work of JISC programmes, I’m also always looking for ways to keep in touch with projects between official programme meetings and feedback on reports. Over the past few years, I have personally found that twitter has been quite revolutionary in that regard. It gives me a flexible ‘lite” way to build relationships, monitor and share project developments. I’ve also noted how twitter is becoming a key dissemination tool for projects and indeed programmes. So I was fascinated to see Martin’s table and what sources he had used.

Like many others I’m becoming increasingly interested in the numerous ways that social services such as facebook, twitter, google+ etc can be used and analyzed. I’ve got my peer-index, checked out my klout – even this morning I had to have a look at twtrland to see what that service made of me. But I do take all of these with a pinch of salt, they give indication of things but not the whole picture.

For this exercise, Martin has used several sources of data including twitter, facebook, linked-in, google+, buzz, digg, delicious, stumbleupon. (See Martin’s post on how he did it). A number of things struck me on first looking at the spreadsheet. The top projects seemed to be related to “big” collections and repository focused. There wasn’t a lot from the teaching and learning side of things till around the mid 20s the Open Spires project, again though this is very much a content related project. Also the top projects all had high scores on the bookmarking sites. Facebook and Linked-In use seemed to be limited, but again the top projects all had relatively high scores. Twitter seemed to be the most consistently used service across the board. And perhaps most striking, after the top twenty or so use of all the services decreases dramatically.

So what does this all mean? Is the fact that the top ranked projects have high bookmarking scores mean that the projects actively encourage sharing in this way – or is it down to the already web-savvy habits of their users? Checking the first couple of projects, it’s hard to tell. The first 2 don’t have any obvious links/buttons to any of the “ranked services”, but the 3rd one has a google sharing app on its front page, and others have obvious links to facebook, twitter etc. I think there would almost need to be a follow up mini-report from each project on their assessment of the impact of these services to start to be able to make any informed comment. What impact does using social services have on sustainability? Does having a facebook page make a project more likely to maintain an up to date web site as per grant funding (see Martin’s post on this too)? Another point of note is that the links for a number of the top ranked projects go to generic and not project specific websites.

I’m not sure I’ve come to any conclusions about this, as with any data collection exercise it has raised more questions that it has answered, and the ranking it provides can’t be judged in isolation. For me, it would be interesting enhance the data to identify what programmes the projects have been funded from and then start to explore the evidence around the effectiveness of each of the social channels. However, it is fascinating to see another example of the different ways people can now start pulling “social” statistics together. Thanks Martin!

Corporate memory, timelines and memolane

This week we had one of our quite rare all of CETIS staff meetings. During the discussions over the two days, communication and how to be smarter, better at sharing what we do amongst ourselves was a recurring theme. If you keep up with the CETIS news feed you’ll probably realise that we cover quite large range of activities and that’s only the “stuff” we blog about. It doesn’t represent all of our working activities.

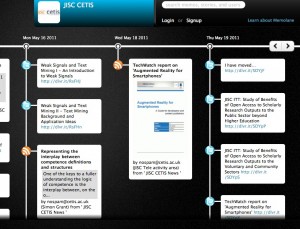
This morning I was reminded of another time-based aggregation service called memolane. Being a bit of a sucker for these kind of things I had signed up to it last year, but actually had forgotten all about it. However I did have another look today and set up JISC CETIS account with RSS feeds from our twitter account and our news and features; and I was pleasantly surprised. The screenshot below gives an indication of the timeline.

JISC CETIS memolane timeline

JISC CETIS memolane timeline

The team at memolane have released embedding functionality, but as we are super-spam-conscious here our wordpress installation doesn’t like to embed things. I have to also add that the memolane team were super quick at picking on a tweet about embedding and have been really helpful. Top marks for customer service.

As a quick and easy way to create and share aspects of a collective memory of organisational activities and output, I think this has real potential. I also think that this could also be useful for projects as a collective memory of their activities (you can of course and multiple feeds from youtube, slideshare etc too). I’d be interested in hearing your thoughts – is this something that actually might only make sense for us and our funders? Or do you think this type of thing would be useful in a more visible section of the CETIS website?

**Update August 2011**

The embed feature now works!

#cetis10 snapshot of backchannel and amplification

Another year, another CETIS conference. Monday and Tuesday this week saw around 140 delegates join us at the National College for Leadership of Schools and Childrens’ Services Conference Centre in Nottingham for the 2010 CETIS Conference “Never Waste a Good Crisis – Innovation & Technology in Institutions.

Over the past few years, the backchannel conversations via twitter have provided a valuable addition to the conference surfacing opinions and alternative discussions, and also as a view into to conference for those not there in person. Despite some fears over the robustness of the venue internet connection, this year again saw a lot of online activity via twitter and blogs.

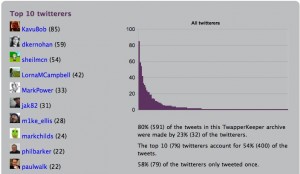
We utilised the twapper keeper service with the conference hash tag #cetis10 and the summarizr report it automatically generates is a useful snapshot of the conversations that took place. Our top (non CETIS) tweeter this year was David Kernohan – as he said himself nothing can stop him from tweeting.
screen-capture-3

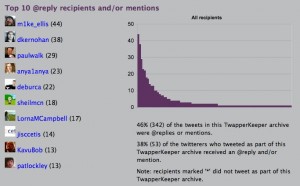
Our top “conversation” was had between Paul Walk and @mIke_ellis. From a personal point of view, seems I tweet quite a bit but don’t really generate that much response – which is a quite like how I feel in real life at times too ;-)
screen-capture-4

Other uses of twitter came from Lorna Campbell who blogged about a twitter exchange during the first keynote by Anya Kamanetz, and James Burke who used the storify service to create a view of the collate, aggregate and locate session. (BTW I really like storify but seem to be bottom of the their invite list, so a quick plea, if anyone has spare invitations, can I have one please?). Paul walk also used flickr to create a summary of the open innovation strand, using the “picture speaks a thousand words” metaphor.

We also set up a lanyard site for the conference this year. This was quite useful for pre-conference activity but to be honest I didn’t use it during the conference so probably need a bit more reflection on how it integrated with our existing conference site. I would of course be interested to hear other’s views on it – is this something we should use for other CETIS events?

As an experiment we’ve also used the paper.li service to create an online newspaper once again using the conference hashtag. We’ll only do this for a limited time (i.e a couple of days) but I’m wondering if this might be useful for our other events which have dedicated hashtags, to collate tweet, blog posts and a some other randomly related “stuff’.

So there you have it, a short summary of some of the online activity from this year’s conference. Thanks to everyone who took the time to engage with the conference. There will be more blogs (and tweets) over the coming days posted onto our website.

The changing nature of technology innovation

I’ve just watched Clay Shirky’s recent talk on ted.com on “how twitter can change history“. Although the content of the talk is very topical there are added nuances this week in particular with the explosion of community driven social media interactions around the Iranian election.

One of the key premises of the presentation it that the nature of technological innovation is changing; primarily due to the most participatory and social nature of collaborative web 2.0 technologies. He goes so far as to say technologies “don’t get socially interesting until they get technologically boring”. And once they become socially interesting the impact they have can be profound. (Clay references China in the talk but there are obvious parallels with the current situation in Iran). The real power is at not the “shiny” developer end but at the point where technologies become ubiquitous and can be harnessed by communities in ways not realised by developers.

This really got me thinking about the nature of an innovation centre such as CETIS. Traditionally we have been right at the “shiny edge” of things; playing with all the new things then leaving them behind once they become close to mainstream and moving on the the next glittering thing on the horizon. But are we missing a trick? Maybe we should be sticking around a bit longer with certain technologies to see how and if ubiquity fosters innovation in education.

In some ways I think we are starting to be more engaged at the socially innovative end of things. Undoubtedly for those of us who twitter it has provided us with an added communication dimension both with our direct work colleagues and our wider community. I’ve been on it for about 2 years now and still can’t see anything at the moment that is going to replace it.

In our outward facing service role, activities such as the widget working group are allowing us to be more engaged with teaching practitioners. From the outset we realised that there would be two distinct phases of this work, beginning with the technical infrastructure and then moving on to the user creation and use stage. I really hope that we can continue in this vein and that our own use of social technology can help us become more a part of the everyday experience for educators and not just the geek ship on the horizon.