Like many others I’m becoming increasingly interested in the many ways we can now start to surface and visualise connections on social networks. I’ve written about some aspects social connections and measurement of networks before.
My primary interest in this area just now is more at the CETIS ISC (innovation support centre) level, and to explore ways which we can utilise technology better to surface our networks, connections and influence. To this end I’m an avid reader of Tony Hirst’s blog, and really appreciated being able to attend the recent Metrics and Social Web Services workshop organised by Brian Kelly and colleagues at UKOLN to explore this topic more.
Yesterday, promoted by a tweet of a visualisation of the twitter community at the recent eAssessment Scotland conference, the phrase “betweenness centrality” came up. If you are like me, you may well be asking yourself “what on earth is that?” And thanks to the joy of twitter this little story provides an explanation (the zombie reference at the end should clarify everything too!)
View “Betweenness centrality – explained via twitter” on Storify
In terms of CETIS, being able to illustrate aspects of our betweenness centrality is increasingly important. Like others involved in innovation and community support, it is often difficult to qualify and quantify impact and reach, and we often have to rely on anecdotal evidence. On a personal level, I do feel my own “reach” an connectedness has been greatly enhanced via social networks. And through various social analysis tools such as Klout, Peer Index and SocialBro I am now gaining a greater understand of my network interactions. At the CETIS level however we have some other factors at work.
As I’ve said before, our social media strategy has raised more through default that design with twitter being our main “corporate” use. We don’t have a CETIS presence on the other usual suspects Facebook, Linkedin , Google+. We’re not in the business of developing any kind of formal social media marketing strategy. Rather we want to enhance our existing network, let our community know about our events, blog posts and publications. At the moment twitter seems to be the most effective tool to do that.
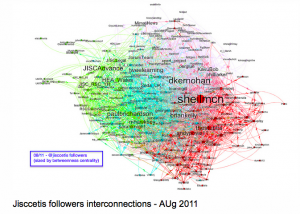
Our @jisccetis twitter account has a very “lite” touch. It primarily pushes out notifications of blog posts and events, we don’t follow anyone back. Again this is more by accident by design, but this has resulted in a very “clean” twitter stream. On a more serious note, our main connections are built and sustained through our staff and their personal interactions (both online and offline). However, even with this limited use of twitter (and I should point out here that not all CETIS staff use twitter) Tony has been able to produce some visualisations which start to show the connections between followers of the @jisccetis account and their connections. The network visualisation below shows a view of those connections sized by betweenness centrality.

So using this notion of betweenness centrality we can start to see, understand and identify some key connections, people and networks. Going back to the twitter conversation, Wilbert pointed out ” . . . innovation tends to be spread by people who are peripheral in communities”. I think this is a key point for an Innovation Support Centre. We don’t need to be heavily involved in communities to have an impact, but we need to be able to make the right connections. One example of this type of network activity is illustrated through our involvement in standards bodies. We’re not at always at the heart of developments but we know how and where to make the most appropriate connections at the most appropriate times. It is also increasingly important that we are able to illustrate and explain these types of connections to our funders, as well as allowing us to gain greater understanding of where we make connections, and any gaps or potential for new connections.
As the conversation developed we also spoke about the opportunities to start show the connections between JISC funded projects. Where/what are the betweenness centralities across the e-Learning programme for example? What projects, technologies and methodologies are cross cutting? How can the data we hold in our PROD project database help with this? Do we need to do some semantic analysis of project descriptions? But I think that’s for another post.
