Category Archives: learning analytics
Report on Modernisation of Higher Education: Focus on Open Access and Learning Analytics
New Modes of Learning and Teaching in Higher Education
 Via a post on the Learning Analytics Community Exchange (LACE) LinkedIn group which described how a “Report on Modernisation of Higher Education specifically refers to LA [learning analytics]” I came across the High Level Group’s report on the Modernisation of Higher Education which covers New modes of learning and teaching in higher education. The 37 page report, available in PDF format, provides two quotations which are likely to welcomed by educational technologists.
“We need technology in every classroom and in every student and teacher’s hand, because it is the pen and paper of our time, and it is the lens through which we experience much of our world” David Warlick
and:“… if we teach today as we taught yesterday, we rob our children of tomorrow” John Dewey
What is Learning Analytics?
Our research department is currently housing a student from a different institution who is interested in mobile learning. She has just finished her doctorate in a Spanish university and is about to head home to China. During a welcome meeting our guest proclaimed an interested in mobile learning and Learning Qnalytics. One of our departments professors then singled me out, “David knows all about Learning Analytics”.
I really should know about Learning Analytics. I’m currently involved in a EU project with the term Learning Analytics in the title. I helped write a paper on tools for learning analytics and have read many papers coming out of our department on it.
The student looked at me, raised an eyebrow. I waved my hand, said that we can catch up later, worried that I still don’t haven’t a clue about Learning Analytics. I just don’t have an answer to the question: ‘what is Learning Analytics?’. I can’t claim that data informed decision-making is a new thing, I don’t suppose it’s even new in the context of applying it to education. Also, how does it differ to educational data mining? I’ve never really understood that; I read somewhere that education data mining included academic analytics in it’s scope, I guess because academics aren’t learning anything they can’t be included in learning analytics, who knows.
The trouble is that when it comes to Learning Analytics I don’t think there is a good snappy sound bite on learning analytics to spurt out when your professor drops you in it at the meeting. Fortunately there a list of 5 things in a Cetis briefing paper by my colleagues that I always return too whenever I am lost in learning analytics. These 5 areas of learning analytics are
New Activity Data and Paradata Briefing Paper
Cetis have published a new briefing paper on Activity Data and Paradata. The paper presents a concise overview of a range of approaches and specifications for recording and exchanging data generated by the interactions of users with resources.
Such data is a form of Activity Data, which can be defined as “the record of any user action that can be logged on a computer”. Meaning can be derived from Activity Data by querying it to reveal patterns and context, this is often referred to as Analytics. Activity Data can be shared as an Activity Stream, a list of recent activities performed by an individual. Activity Streams are often specific to a particular platform or application, e.g. facebook, however initiatives such as OpenSocial, ActivityStreams and Tin Can API have produced specifications and APIs to share Activity Data across platforms and applications.
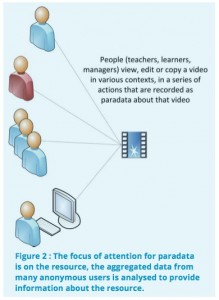
 While Activity Streams record the actions of individual users and their interactions with multiple resources and services, other specifications have been developed to record the actions of multiple users on individual resources. This data about how and in what context resources are used is often referred to as Paradata. Paradata complements formal metadata by providing an additional layer of contextual information about how resources are being used. A specification for recording and exchanging paradata has been developed by the Learning Registry, an open source content-distribution network for storing and sharing information about learning resources.
The briefing paper provides an overview of each of these approaches and specifications along with examples of implementations and links to further information.
The Cetis Activity Data and Paradata briefing paper written by Lorna M. Campbell and Phil Barker can be downloaded from the Cetis website here: http://publications.cetis.org.uk/2013/808
Doing analytics with open source linked data tools
Like most places, the University of Bolton keeps its data in many stores. That’s inevitable with multiple systems, but it makes getting a complete picture of courses and students difficult. We test an approach that promises to integrate all this data, and some more, quickly and cheaply.
Integrating a load of data in a specialised tool or data warehouse is not new, and many institutions have been using them for a while. What Bolton is trying in its JISC sponsored course data project is to see whether such a warehouse can be built out of Linked Data components. Using such tools promises three major advantages over existing data warehouse technology:
It expects data to be messy, and it expects it to change. As a consequence, adding new data sources, or coping with changes in data sources, or generating new reports or queries should not be a big deal. There are no schemas to break, so no major re-engineering required.
It is built on the same technology as the emergent web of data. Which means that increasing numbers of datasets – particularly from the UK government – should be easily thrown into the mix to answer bigger questions, and public excerpts from Bolton’s data should be easy to contribute back.
It is standards based. At every step from extracting the data, transforming it and loading it to querying, analysing and visualising it, there’s a choice of open and closed source tools. If one turns out not to be up to the job, we should be able to slot another in.
But we did spend a day kicking the tires, and making some initial choices. Since the project is just to pilot a Linked Enterprise Data (LED) approach, we’ve limited ourselves to evaluate just open source tools. We know there plenty of good closed source options in any of the following areas, but we’re going to test the whole approach before deciding on committing to license fees.
Data sources


Before we can mash, query and visualise, we need to do some data extraction from the sources, and we’ve come down on two tools for that: Google Refine and D2RQ. They do slightly different jobs.
Refine is Google’s power tool for anyone who has to deal with malformed data, or who just wants to transform or excerpt from format to another. It takes in CSV or output from a range of APIs, and puts it in table form. In that table form, you can perform a wide range of transformations on the data, and then export in a range of formats. The plug-in from DERI Galway, allows you to specify exactly how the RDF – the linked data format, and heart of the approach – should look when exported.
What Refine doesn’t really do (yet?) is transform data automatically, as a piece of middleware. All your operations are saved as a script that can be re-applied, but it won’t re-apply the operations entirely automagically. D2RQ does do that, and works more like middleware.
Although I’ve known D2RQ for a couple of years, it still looks like magic to me: you download, unzip it, tell it where your common or garden relational database is, and what username and password it can use to get in. It’ll go off, inspect the contents of the database, and come back with a mapping of the contents to RDF. Then start the server that comes with it, and the relational database can be browsed and queried like any other Linked Data source.
Since practically all relevant data in Bolton are in a range of relational databases, we’re expecting to use D2R to create RDF data dumps that will be imported into the data warehouse via a script. For a quick start, though, we’ve already made some transforms with Refine. We might also use scripts such as Oxford’s XCRI XML to RDF transform.
Storage, querying and visualisation
We expected to pick different tools for each of these functions, but ended up choosing one, that does it all- after a fashion. Callimachus is designed specifically for rapid development of LED applications, and the standard download includes a version of the Sesame triplestore (or RDF database) for storage. Other triple stores can also be used with Callimachus, but Sesame was on the list anyway, so we’ll see how far that takes us.
Callimachus itself is more of a web application on top that allows quick visualisations of data excerpts- be they straight records of one dataset or a collection of data about one thing from multiple sets. The queries that power the Callimachus visualisations have limitations – compared to the full power of SPARQL, the linked data query language – but are good enough to knock up some pages quickly. For the more involved visualisations, Callimachus SPARQL 1.1 implementation allows the results a query to be put out as common or garden JSON, for which many different tools exist.
Next steps
We’ve made some templates already that pull together course information from a variety of sources, on which I’ll report later. While that’s going on, the main other task will be to set up the processes of extracting data from the relational databases using D2R, and then loading it into Callimachus using timed scripts.