Linked Data meshup on a string

I wanted to demo my meshup of a triplised version of CETIS’ PROD database with the impressive Linked Data Research Funding Explorer on the Linked Data meetup yesterday. I couldn’t find a good slot, and make my train home as well, so here’s a broad outline:

The data

The Department for Business Innovation and Skills (BIS) asked Talis if they could use the Linked Data Principles and practice demonstrated in their work with data.gov.uk to produce an application that would visualise some grant data. What popped out was a nice app with visuals by Iconomical, based on a couple of newly available data sets that sit on Talis’ own store for now.

The data concerns research investment in three disciplines, which are illustrated per project, by grant level and number of patents, as they changed over time and plotted on a map.

CETIS have PROD; a database of JISC projects, with a varying amount of information about the technologies they use, the programmes they were part of, and any cross links between them.

The goal

Simple: it just ought to be possible to plot the JISC projects alongside the advanced tech of the Research Funding Explorer. If not, than at least the data in PROD should be augmentable with the data that drives the Research Funding Explorer.

Tools

Anything I could get my hands on, chiefly:

The recipe

For one, though PROD pushes out Description Of A Project (DOAP, an RDF vocabulary) files per project, it doesn’t quite make all of its contents available as linked data right now. The D2R toolkit was used to map (part of) the contents to known vocabs, and then make the contents of a copy of PROD available through a SPARQL interface. Bang, we’re on the linked data web. That was easy.

Since I don’t have access to the slick visualisation of the Research Funding Explorer, I’d have to settle for augmenting PROD’s data. This is useful for two reasons: 1) PROD has rather, erm, variable institutional names. Synching these with canonical names from a set that will go into data.gov.uk is very handy. 2) PROD doesn’t know much about geography, but Talis’ data set does.

To make this work, I made a SPARQL query that grabs basic project data from PROD, and institutional names and locations from the Talis data set, and visualises the results.

Results
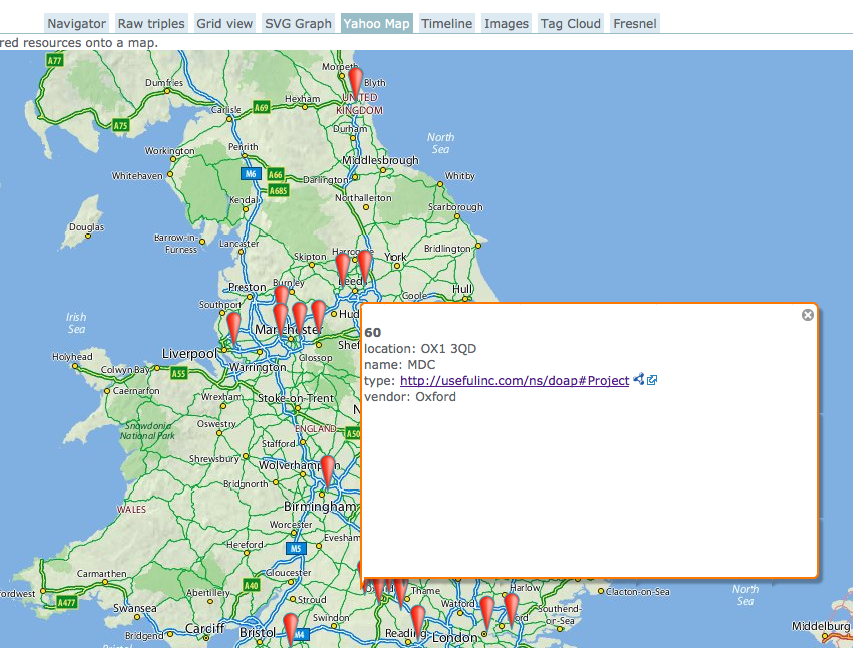
A partial map of England, Wales and southern Scotland with markers indicating where projects took place
An excerpt of PROD project data, augmented with proper institutional names and geographic positions from Talis’ Research Grant Explorer, visualised in OpenLink RDF browser.
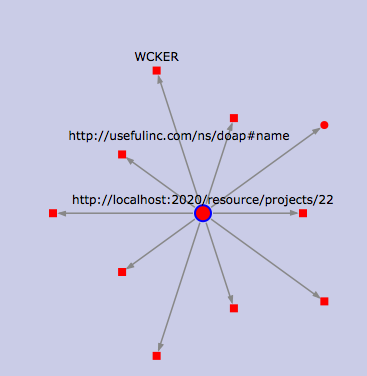
A star shaped overview of various attributes of a project, with the name property highlighted
Zooming in on a project, this time to show the attributes of a single project. Still in OpenLink RDF browser.
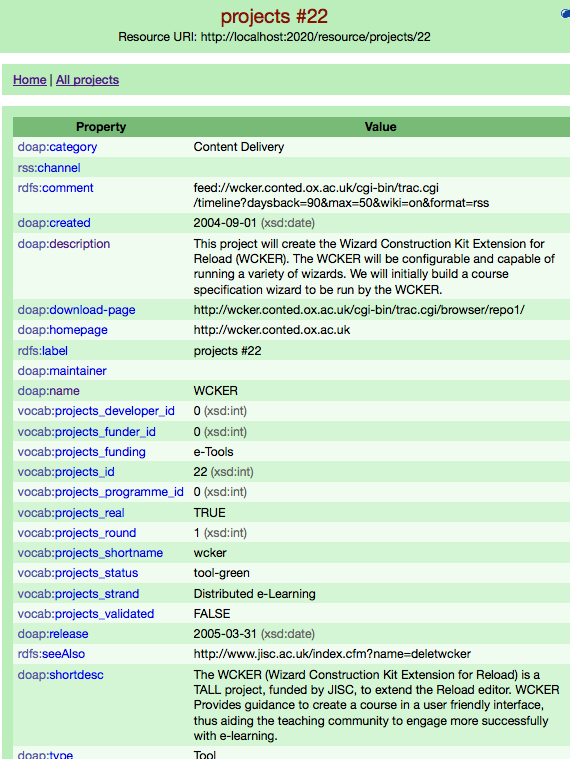
A two column list of one project's attributes and their values
A project in D2R’s web interface; not shiny, but very useful.

From blagging a copy of the SQL tables from the live PROD database to the screen shots above took about two days. Opening up the live server straight to the web would have cut that time by more than half. If I’d have waited for the Research Grant Explorer data to be published at data.gov.uk, it’d have been a matter of about 45 minutes.

Lessons learned

Opening up any old database as linked data is incredibly easy.

Cross-searching multiple independent linked data stores can be surprisingly difficult. This is why a single SPARQL endpoint across them all, such as the one presented by uberblic‘s Georgi Kobilarov yesterday, is interesting. There are many other good ways to tackle the problem too, but whichever approach you use, making your linked data available as simple big graphs per major class of thing (entity) in your dataset helps a lot. I was stymied somewhat by the fact that I wanted to make use of data that either wasn’t published properly yet (Talis’ research grant set), or wasn’t published at all (our own PROD triples).

A bit of judicious SPARQLing can alleviate a lot of inconsistent data problems. This is salient to a recent discussion on twitter around Brian Kelly’s Linked Data challenge. One conclusion was that it was difficult, because the data was ‘bad’. IMHO, this is the web, so data isn’t really bad, just permanently inconsistent and incomplete. If you’re willing to put in some effort when querying, a lot can be rectified. We, however, clearly need to clean up PROD’s data to make it easier on everyone.

SPARQL-panning for gold in multiple datastores (or even feeds or webpages) is way too much fun to seem like work. To me, anyway.

What’s next

What needs to happen is to make all the contents of PROD and related JISC project information available as proper linked data. I can see three stages for this:

  1. We clean up the PROD data a little more at source, and load it into the Data Incubator to polish and debate the database to triple mapping. Other meshups would also be much easier at that point.
  2. We properly publish PROD as linked data either on a cloud platform such as Talis’, or else directly from our own server via D2R or OpenLink Virtuoso. Simal would be another great possibility for an outright replacement of PROD, if it’s far enough along at that point.
  3. JISC publishes the public part of its project information as Linked Data, and PROD just augments (rather than replicates) it.

Pinning enterprise architecture to the org chart

Recent discussion during the Open Group’s Seattle conference shows that we’re still not done debating the place of Enterprise Architecture (EA) in an organisation.

For one thing, EA is still a bit of a minority sport, as Tim Westbrock reminded everyone: 99+% of organisations don’t do EA, or, at least, not consciously. Nonetheless, impressive, linear, multi-digit growth in downloads and training in The Open Group’s Architectural Framework (TOGAF) indicates that an increasing number of organisations want to surface their structure.

Question is: where does that activity sit?

Traditionally, most EA practice comes out of the IT department, because the people in it recognise that an adequate IT infrastructure requires a holistic view of the organisation and its mission. As a result, extraordinary amounts of time and energy are spent on thinking about, engaging with, thinking as or generally fretting about “the business” in EA circles. To the point that IT systems or infrastructure are considered unmentionable.

While morally laudable, I fear that this anxiety is a tad futile if “the business” is unwilling or unable to understand anything about IT – as it frequently seems to –, but that’s just my humble opinion.

Mike Rollins of the Burton Group seems to be thinking along similar lines, in his provocative notion that EA is not something that you are, but something that you do. That is, in order for an architectural approach to be effective, you shouldn’t have architects (in the IT department or elsewhere), but you should integrate doing EA into the general running of the organisation.

Henri Peyret of Forrester wasn’t quite so willing to tell an audience of a few hundred people to quit their jobs, but also emphasised the necessity to embed EA in the general work of the organisation. In practical terms, that the EA team should split their time evenly between strategic work, and regular project work.

Tim Westbrock did provide a sharper contrast with the notion of letting EA become an integral part of the whole organisation inasmuch as he argued that, in a transformative scenario, the business and IT domains become separate. The context, though, was his plea for ‘business architecture’, which, simplifying somewhat, looks like EA done by non-IT people using business concepts and language. In such a situation, the scope of the IT domain is pretty much limited to running the infrastructure and coaching ‘the business’ in the early phases of the deployment of a new application that they own.

Stuart MacGregor of realIRM was one of the few who didn’t agonise so much about who’d do EA and where, but he did make a strong case for two things: building and deploying EA capacity long term, and spending a lot of time on the soft, even emotional side of engaging with other people in the organisation. A consequence of the commitment to the long term is to wean EA practices of their addiction to ‘quick wins’ and searches for ‘burning platforms’. Short term fixes nearly always have unintended consequences, and don’t necessarily do anything to fix the underlying issues.

Much further beyond concerns of who and where is the very deep consideration of the concepts and history of ‘architecture’ as applied to enterprise of Len Fehskens of the Open Group. For cyberneticians and soft systems adepts, Len’s powerpoint treatise is probably the place to start. Just expect your heckles to be raised.

Resources

Tim Westbrock’s slides on Architecting the Business is Different than Architecting IT

Mike Rollins’ slides on Enterprise Architecture: Disappearing into the Business

Henry Peyret’s slides on the Next generation of Enterprise Architects

Stuart MacGregor’s slides on Business transformation Powered by EA

Len Feshkens slides on Rethinking Architecture

On integrating Wave, Wookie and Twitter

Stitching together the new ‘realtime’ collaborative platforms seems an obvious thing to be doing in theory, but throws up some interesting issues in practice.

Back when Wave was first demonstrated by Google, one of the robots (participants in a Wave that represent some machine or service) that got a few minutes in the limelight was Tweety the twitterbot. Tweety showed how updates to a Wave can be piped through to Twitter, and vice versa. Great, you can follow conversations in the one, without leaving the other.

Tweety the twitterbot pipes tweets into a Wave

Tweety the twitterbot pipes tweets into a Wave

In the same vein, when Google unveiled Wave Gadgets (small applications that can be integrated into a Wave), their collaborative, multi-user, concurrent or realtime nature was so similar to Wookie, that Scott Wilson converted them to run on Wookie rather than Wave. Now that Wave is slowly opening up, what could be more natural than seeing whether a bunch of people on a Wave could be interacting with a bunch of people in Moodle via a Wookie widget?

Technically, all this is possible, and I’ve seen it work- but it does require some thinking about how the contexts fit together.

For example, Tweety relays all tweets from all followers of one account to everyone in a Wave. Worse, it relays everyone’s blips from that Wave as separate tweets via the one account. Apart from the fact that seeing other people’s contributions appear in your own name, the Wave conversation is just too noisy and fast to make any sense in a micro-blogging context. Likewise, all tweets from all followers of one person (live!) is a lot of noise when a worthwhile Wave conversation can only really be about a couple of linked tweets between a few followers.

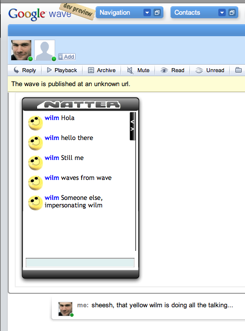
The Wookie ‘Natter’ chat widget in Wave integration looked more of a natural fit. As integrations go, this was pretty shallow: Natter is displayed in Wave, but has no idea who is interacting with it there. Put differently, everyone in Wave is just one participant in Natter. This is potentially quite useful, as everyone else in Natter is in a wholly different environment, and therefore engaged in a different activity. They can’t see what’s going on in the linked Wave. Channelling contributions through one entity therefore makes sense; linked but separate.

The Wookie 'Natter' chat widget in Wave

The Wookie 'Natter' chat widget in Wave

A deeper integration where Wave participants showed up in a Wookie widget properly, much like Moodle or Elgg based people do now, looks technically feasible and socially doable. Unlike Twitter and Wave, the basic user interaction models of Wookie and Wave look similar enough not to jar.

Other integrations are also conceivable: you could push updates on a Wookie widget as blips to a Wave via a robot (Tweety-style) and vice versa, but that looks like a lot of effort for not much gain over a widget approach.

Longer term, though, the best way to integrate realtime platforms seems to be via something like the Wave protocol. That way, people can pick and choose the environment and/or user interface that suits them, independent of the social context or network they’re interacting with. Fortunately, that’s what Google is aiming for with some more releases of open source client and server code and updates to the Wave protocol.

For a wider overview of Wave and its potential for teaching and learning, see my earlier post

Blackboard pledges open standard support.

Ray Henderson, President of Blackboard’s Teaching and Learning division, formerly of Angel learning, made a very public commitment to supporting standards yesterday.

Although even Ray admits that the final proof will be in the software if and when it arrives, the public statement alone is something that I genuinely thought would never happen. From its inception, Blackboard, and most of the rest of the closed source educational technology community, have followed a predictable US technology market path: to be the last competitor standing was the goal, and everyone would betray every stakeholder they had before they’d be betrayed by them. As with other applications of Game theory in the wild, though, there seems to be at least a suggestion that people are willing to cooperate, and break the logic of naked self-interest.

What’s on offer from Ray is, first and foremost, implementation of IMS’ Common Cartridge, followed by other IMS specifications such as Learning Tool Interoperability (LTI) and Learner Information Services (LIS). SCORM and the Schools Interoperability Framework (SIF) also get a mention.

On the CC front, the most interesting aspect by far is a pledge to support not just import of cartridges, but also export. In a letter to customers, Ray explicitly mentions content authored by faculty on the system, which suggests that it wouldn’t just mean re-export of canned content. You’d almost think that this could be the end of the content “Blackhole”

Catches?

The one immediate catch is this:

creators of learning content and tools will of course still need to have formal partnerships (for example in our case participating in the Blackboard Building Blocks program or the Blackboard Content Provider network) with platform providers like us in order to connect their standards-compliant tool or content to eLearning platforms through supported interfaces.

This doesn’t strike me as at all obvious, and the given reasons – to ensure stability and accountability – not entirely convincing. That customers are on their own if they wish to connect a random tool that claims to exercise most of IMS LTI 2.0, I can understand. But I don’t quite understand why a formal relationship is required to upload some content, nor how that would work for content authors who don’t normally enter into such formal relations with vendors. It’s also not easy to see how such a business requirement would be enforced without breaking the standard.

The other potential catch is that Blackboard’s political heft, combined with its platform’s technical heft, means that the standards that it wants to lead on end up with high barriers to entry. That is, interfaces that are easy to add to Blackboard, may not be so easy to add to anything else. And given Blackboard’s market position, it’s their preferences that might well trump others.

Still, the very public commitment is to the open standards, and the promise is that the code will vindicate that commitment. Even a partial return on that promise will make a big difference to interoperability in the classic VLE area.

Google Wave and teaching & learning

The announcement of Google’s new Wave technology seems to be causing equal parts excitement and bafflement. For education, it’s worth getting through the bafflement, because the potential is quite exciting.

What is Google Wave?

There’s many aspects, and the combination of features is rather innovative, so a degree of blind-people-describing-an-elephant will probably persist. For me, though, Google Wave exists on two levels: one is as a particular social networking tool, not unlike facebook, twitter etc. The other is as a whole new technology, on the same level as email, instant messaging or the web itself.

As a social networking tool, Wave’s brain, erm, ‘wave’ is that it focusses on the conversation as the most important organising principle. Unlike most existing social software, communication is not between everyone on your friends/buddies/followers list, but between everyone invited to a particular conversation. That sounds like good old email, but unlike email, a wave is a constantly updated, living document. You can invite new people to it, watch them add stuff as they type, and replay the whole conversation from the beginning.

As a new technology, then, Google Wave turns every conversation (or ‘wave’ in Google speak) into a live object on the internet, that you can invite people and other machine services (‘robots’) to. The wave need not be textual, you can also collaborate on resources or interact with simple tools (‘gadgets’). Between them, gadgets and robots allow developers to bring in all kinds of information and functionality into the conversation.

The fact that waves are live objects on the internet points to the potential depth of the new technology. Where email is all about stored messages, and the web about linked resources, Wave is about collaborative events. As such, it builds on the shift to a ‘realtime stream’ approach to social interaction that is being brought about by twitter in particular.

The really exciting bit about Wave, though, is the promise that – like email and the web, and unlike most social network tools – anyone can play. It doesn’t rely on a single organisation; anyone with access to a server should be able to set up a wave instance, and communicate with other wave instances. The wave interoperability specifications look open, and the code that Google uses will be open sourced too.

Why does Wave matter for teaching and learning?

A lot of educational technology centres around activity and resource management. If you take a social constructivist approach to learning, the activity type that’s most interesting is likely to be group collaboration, and the most interesting resources are those that can be constructed, annotated or modified collaboratively.

A technology like Google Wave has the potential to impact this area significantly, because it is built around the idea of real time document collaboration as the fundamental organising concept. More than that, it allows the participants to determine who is involved with any particular learning activity; it’s not limited to those that have been signed up for a whole course, or even to those who where involved in earlier stages of the collaboration. In that sense, Google Wave strongly resembles pioneering collaborative, participant-run, activity focussed VLEs such as Colloquia (disclosure: my colleagues built Colloquia).

In order to allow learning activities to become independent of a given VLE or web application, and in order to bring new functionality to such web applications, Widgets have become a strong trend in educational technology. Unlike all these educational widget platforms (bar one: wookieserver), however, Wave’s widgets are realtime, multi-user and therefore collaborative (disclosure: my colleagues are building wookieserver).

That also points to the learning design aspect of Wave. Like IMS Learning Design tools (or LD inspired tools such as LAMS), Wave takes the collaborative activity as the central concept. Some concepts, therefore, map straight across: a Unit of Learning is a Wave, an Act a Wavelet, there are resources, services and more. The main thing that Wave seems to be missing natively is the concept of role, though it looks like you can define them specifically for a wave and any gadgets and robots running on them.

In short, with a couple of extensions to integrate learning specific gadgets, and interact with institutional systems, Waves could be a powerful pedagogic tool.

But isn’t Google evil?

Well, like other big corporations, Google has done some less than friendly acts. Particularly in markets where it dominates. Social networking, though, isn’t one of those markets, and therefore, like all companies that need to catch up, it needs to play nice and open.

There might still be some devils in the details, and there’s an awful lot that’s still not clear. But it does seem that Google is treating this as a rising platform/wave that will float all boats. Much as they do with the general web.

Will Wave roll?

I don’t think anyone knows. But the signs look promising: it synthesises a number of things that are happening anyway, particularly the trend towards the realtime stream. As with new technology platforms such as BBSs and the web in the past, we seem to be heading towards the end of a phase of rapid innovation and fragmentation in the social software field. Something like Wave could standardise it, and provide a stable platform for other cool stuff to happen on top of it.

It could well be that Google Wave will not be that catalyst. It certainly seems announced very early in the game, with lots of loose ends, and a user interface that looks fairly unattractive. The concept behind it is also a big conceptual leap that could be too far ahead of its time. But I’m sure something very much like Wave will take hold eventually.

Resources:

Google’s Wave site

Wave developer API guide. This is easily the clearest introduction to Wave’s concepts- short and not especially technical

Very comprehensive article on the ins and outs at Techcrunch

IMS QTI and the economics of interoperability

In the twelve years of its existence, an awful lot has been learned about interoperability by IMS staff and members. This is nowhere more apparent than in the most quintessentially educational of interoperability standards: question and test items (QTI). A recent public spat about the IMS QTI specification provides an interesting contrast to two emerging views of how to achieve interoperability. Fortunately for QTI, they’re not incompatible with each other.

Under the old regime, the way interoperability was achieved was by establishing consensus among the largest number of stakeholders possible, create a spec, publish it and wait for the implementations to follow. With the benefit of hindsight, it’s fair to say that the results have been mixed.

Some IMS specs got almost no implementation at all, some galvanised a lot of development but didn’t reach production use, and some were made to work for particular communities by their particular communities. On the whole, many proved remarkably flexible in use, and of sound technical design.

Trouble was, more often than not, two implementations of the same IMS spec were not able to exchange data. To understand why, the QTI spec is illustrative, but not unique.

For a question and test spec to be useful to most communities, and for several of these communities to be able to share data or tools, a reasonably wide range of types needs to be supported. QuestionMark (probably the market leader in the sector) uses the wide range of question types that its product supports as a key differentiator. Likewise, though IMS QTI 2.1 is very expressive, a lot of practitioners in the CETIS Assessment SIG frequently discuss extensions to ensure that the specification meets their needs.

The upshot is that QTI 2.1 is implementable, as a fair old list of tools on wikipedia demonstrates, but implementing all of it isn’t trivial. This could be argued to be one reason why it is not in wider use, though the other reason might well be that QTI 2.1 was never released as a final specification, and now is no longer accessible to non-IMS members.

To see how to get out of this status quo, the economics of standard implementation need to be considered. From a vendor’s point of view – open or closed source – , implementing any interoperability spec represents a cost. The more complex and flexible the specification, the higher that cost is. This is not necessarily a problem, as long as the benefit is commensurate. If either the market is large enough, or else the perceived value of the spec high enough for the intended customers to be willing to pay more, the specification will be economically viable.

Broadly two models of interoperability can be used to figure out a way to make a spec economically viable, and which you go for largely depends on your assumptions about the technical architecture of the solution.

One model assumes that all implementations of a spec like QTI are symmetrical and relatively numerous. Numerous as in certainly more than two or three, and possibly double digits or more, and systems as in VLEs. With that assumption, the QTI situation needs clear adjustment. The VLE market is not that large to begin with, and is fairly commoditised. There is little room for investment, and there has not been a demonstrated willingness to pay for extended interoperable question and test features.

From the symmetrical perspective, then, the only way forward is to simplify the spec down to a level that the market will bear, which is to say, very simple indeed. Since, as we’re already seeing with the QTI 1.2 profile in Common Cartridge, it is not possible to satisfy all communities with the same small set of question and test items, there will almost certainly need to be multiple small profiles.

There are several problems with such an approach. For one, reducing the feature set to the lowest cost has a linear relation to the value of the feature set to the end user. Beyond a minimum it might be almost useless. Balkanising the spec’s space to several incompatible subsets is likely to exacerbate this; not just for end-users, but also tool and content vendors.

What’s worse, though, is that the underlying assumption is wrong. Symmetrical interoperability doesn’t work. To my knowledge, and I’d love to be corrected, there are no significant examples of an interoperability spec that has significant numbers of independent implementations that happily export and import each others’ data. The task of coordinating the crucial details of the interpretation of data is just too onerous once the number of data sources and targets that a piece of software has to deal with gets into the double digits.

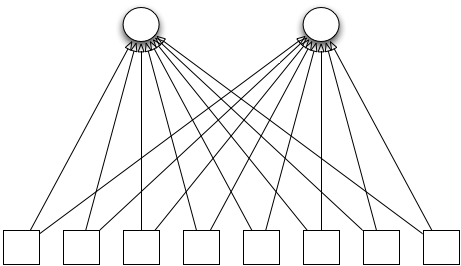
Symetrical, many-to-many interoperability; 8 systems, 56 connections that need to work

Symetrical, many-to-many interoperability; 8 systems, 56 connections that need to work

Within the e-learning world, SCORM 1.2 (and compatible IMS Content Packages) came closest to the symmetric, many-to-many ideal, but only because the spec was very simple, the volume of the market large, compliance often mandated and calculated into Requests For Proposals (RFPs), and vendors were prepared to coordinate their implementations in numerous plugfests and codebashes as a consequence. Also, ADL invested a lot of money in continuous implementation support. Even then, plenty of issues remained, and, crucially, most implementations were not symmetrical: they imported only. Once the complexity of the SCORM increased significantly with the adoption of Simple Sequencing in SCORM 2004, the many-to-many interoperability model broke down.

Instead, the emergence of solutions like Icodeon’s SCORM 2004 plug-in for VLEs brought the spec back to the norm: asymmetrical interoperability. Under this assumption, there will only ever be a handful of importing systems at most, but a limitless number of data sources. It’s how HTML works on the web: uncountable sources that need to target only about four codebases (Internet Explorer, Mozilla, WebKit, Opera), one of which dominates to such an extent that the others need to emulate its behaviour. Same with JPEG picture rendering libraries, BIND implementations and more. In educational technology it is how Simple Sequencing and SCORM 2004 got traction, and it is starting to look as if it will be the way most people will see IMS Common Cartridge too.

Under this assumption, implementing a rich QTI profile in two or three plug-ins or web services becomes economically much more viable. Not only is the amount of required testing much reduced, the effective cost of implementation is spread out over many more systems. VLE vendors can offer the feature for much less, because the total market has effectively paid for just two or three best-of-breed implementations rather than tens of mediocre ones.

Asymetrical, many-to-many interoperability; 8 source systems, 2 consuming systems, 16 connections that need to work

Asymetrical, many-to-many interoperability; 8 source systems, 2 consuming systems, 16 connections that need to work

This is not a theoretic example. Existing rich QTI 2.1 implementations make the asymmetric interoperability assumption. In Korea, KERIS (Korea Education and Research Information Service) is coordinating the development of three commercial implementations of the rendering and test side of QTI, but many specialised authoring tools are envisaged. Likewise, in the UK, two full implementations of the rendering and test management side of QTI exist, but many subject specific authoring tools are envisaged. All existing renderers can be used as a web application, and QTIEngine is also explicitly designed to work as a local plug-in or web service that can be embedded in various VLEs.

That also points to various business models that asymmetric interoperability enables. VLE vendors can focus on the social networking core, and leave the activity specific tools to the specialists with the right expertise. Alternatively, vendors can band together and jointly develop or adopt an open source code library, like the Japanese companies that implemented Simple Sequencing under ALIC auspices, back in the day.

Even if people still want to persist with symmetrical interoperability, designing the specification to accommodate both assumptions is not a problem. All that’s required is one rich profile for the many-to-few, asymmetric assumption, and a very small one for the many-to-many, symmetric assumption. Let’s hope we get both.

Resources

A brief overview of the current QTI 2.1 discussion

Wikipedia’s QTI page, which contains a list of implementations

More on the KERIS QTI 2.1 tools

The QTIEngine demo site

An interview with Kyoshi Nakabayashi, formerly of ALIC, about joint Simple Sequencing implementation work

SOA only really works webscale

Just sat through a few more SOA talks today, and, as usual, the presentations circled ’round to governance pretty quick and stayed there.

The issue is this: soa promises to make life more pleasant by removing duplication of data and functionality. Money is saved and information is more accurate and flows more freely, because we tap directly into the source systems, via their services.

So far the theory. The problem is that organisations in soa exercises have a well documented tendency to re-invent their old monolithic applications as sets of isolated services that make most sense to themselves. And here goes the re-use argument: everyone uses their own set of services, with lots of data and functionality duplication.

Unless, of course, your organisation has managed to set up a Governance Police that makes everyone use the same set of centrally sanctioned services. Which is, let’s say, not always politically feasible.

Which made me think of how this stuff works on the original service oriented architecture: the web. The most obvious attribute of the web, of course, is that there is no central authority over service provision and use. People just use what is most useful to them- and that is precisely the point. Instead of governance, the web has survival of the fittest: the search engine that gives the best answers gets used by everyone.

Trying to recreate that sort of Darwinian jungle within the enterprise seems both impossible and a little misguided. No organisation has the resources to just punt twenty versions of a single service in the full knowledge that at least nineteen will fail.

Or does it? Once you think about the issue webscale, such a trial-and-error approach begins to look more do-able. For a start, an awful lot of current services are commodities that are the same across the board: email, calendars, CRM etc. These are already being sourced from the web, and there are plenty more that could be punted by entrepreneurial -shared – service providers with a nous for the education system (student record system, HR etc.)

That leaves the individual HE institutions to concentrate on those services that provide data and functionality that are unique to themselves. Those services will survive, because users need them, and they’re also so crucial that institutions can afford to experiment before a version is found that does the job best.

I’ll weasel out of naming what those services will be: I don’t know. But I suspect it will be those that deal with the institution’s community (‘social network’ if you like) itself.

Prof. Zhu’s presentation on e-education in China

Initially, it’s hard to get past the eye-popping numbers (1876 universities, 17 million students and so on) but once you do, you’ll see that the higher education sector in China is facing remarkably familiar challenges with some interesting solutions.

We were very fortunate here at IEC that Prof Zhu Zhiting and colleagues from Eastern China Normal University and the China e-Learning Technology Standardization Committee agreed to visit our department after attending the JISC CETIS conference yesterday. He kindly agreed to let us publish his slides, which are linked below.

The two most noticeable aspects of prof. Zhu’s presentation are the nature of planning e-education in China, and the breadth of interests in Prof. Zhu’s Distance Education College & e-Educational System Engineering Research Center.

Because the scale of education in China is so vast, any development has to be based on multiple layers of initiatives. The risks involved mean that the national ministery of education needs to plan at very high, strategic levels, that set out parameters for regional and local governments to follow. This is not new per se, but it leads to a thoroughness and predictability in infrastructure that others could learn from.

The department in Shanghai, though, is another matter. Their projects range from international standardisation right down to the development of theories that integrate short term and long term individual memory with group memory. Combined with concrete projects such as the roll-out of a lifelong learning platform for the citizens of Shanghai, that leads to some serious synergies.

Learn more from Prof. Zhu’s slides

More about IEC and what it does.

A test in learning widgets

In order to explore how widgets can work in teaching and learning practice, I’ve been blue-petering a one-off formative assessment widget. That little exercise uncovers a couple of interesting issues to do with usability, security and pedagogy.

Recipe

Ingredients:

  • Google docs account
  • Sproutbuilder.com account
  • Mediawiki account with friendly administrator
  • Moodle installation with administrator access
  • (optional) iGoogle account, plain html site, Apple Dashboard, Windows Vista Sidebar, etc.

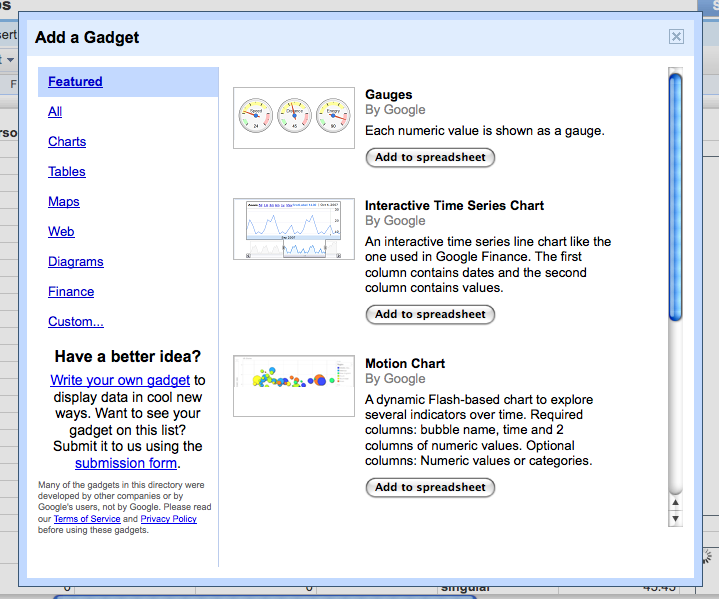
Take the Google docs account, and create a new spreadsheet. Rustle up a form from the toolbar; you have a choice between simple text, paragraph text, multiple choice, checkboxes, choose from a list and a scale. The questions will be added as columns to the first sheet. To calculate marks from the returns, use sheet 2 (the answers from the form will brutally overwrite anything on sheet 1). Refer to the cells in sheet 1 from the formulae in sheet 2. Finish with inserting widgets or charts that sum up your calculations. Send out the form via email, and let the sheet stew.

Google widget

In the mean time, soften up your mediawiki instance by asking your friendly administrator to allow img and object tags in pages. Make sure that the wiki isn’t very public, or you might get burned. To embed the form, go to sproutbuilder.com, and create a widget with the google form as content. Publish the sprout, and copy the object tag code, and trim off the single pixel image code on the end. Stick the object tag in the wiki, et voila.

To display the results, go to the chart in the google spreadsheet you prepared earlier, and publish it. Stir the resulting img tag you will be presented with into the wiki, and enjoy.

The outline for a Moodle instance is fairly similar, but allows greater freedom in what gets mixed in, where- provided you have administrator privileges. The form widget, for example, can be called directly in the iframe Google provides, which can be put into a Moodle html block. Likewise, results gadgets can be stuck in an Moodle html block as the javascript concoction Google dispenses.

Usability and security

As the recipe indicates, the deployment of widgets could be much easier. Getting rid of the copying and pasting of gnarly bits of code is only a minor aspect of this issue; security is the much bigger aspect. The hacking of the mediawiki instance is a tad questionable from that point of view, even if the wiki isn’t open to all miscreants on the web. There is a mediawiki extension that takes care of the trusting and embedding of widgets, but it doesn’t look particularly easy to use.

Much the same goes for deploying widgets in a Moodle instance, even if Moodle’s more fine-grained controls over who has which privileges over what, makes things rather easier. I had a quick look at a web platform like Facebook, and couldn’t find a way in there for my gadgets at all. A lame list of my Google documents was as far as it went.

What’s required here, IMHO, is plug-ins to these web apps that allow administrators to set trusted domains of origin for widgets. That way, regular users can stick in homebrew and pre-packaged widgets from these trusted domains into their favourite platforms without stuffing up security.

When inserting the assessment widget into the VLE, it also struck me that it wasn’t offering a whole lot more functionality than was already there in Moodle. I can imagine that using the Moodle question forms is easier for some people than wrangling spreadsheet formulae too. Still, there are important advantages of using a web app like Google docs or Zoho. Most importantly, the fact that it allows learners and teachers to pick their favourite tools to a common environment. But that does presuppose that deploying the various channels in and out of the docs web app is easy.

Pedagogy

As is usual with a newly found hammer, you start looking for nails that may or may not be there. My first effort (Gadgets and mashups 101, log in as guest) therefore resulted in the shiniest widgets piled on top of each other. There is no indication of the right answer on submission, and the fact that the scores of everyone is plain to see, may not have been the best way to approach the learning activity, though.

The second effort was better, I feel (Gadgets and mashups 102, log in as guest). In this version, there is at least some feedback on submission, and an indication of which questions people struggled with, on average. Even so, using email or a link directly to the form on Google may be better still, with just the average score on each question as a gadget, and a list of respondents just for the teacher.

The spreadsheet can be viewed on Google docs.

You can see what the widgets look like in mediawiki on the CETIS wiki.