@jisccetis – how others see us

Those of you who follow the @jisccetis twitter account will have probably noticed that it is very much a broadcast channel, used to send updates on our latest news, features and events. Those of you who don’t , or no longer follow the account, will probably have noticed that too, and that’s why you don’t /no longer follow it. Over the coming weeks we’re going to be making some subtle changes, and this post will try to outline our rationale.

As I’ve commented before, use of the @jisccetis account has evolved more by accident than by design or any kind of strategic planning other than “we should have one of those twitter accounts shouldn’t we”. Partly this is due to the number/ and activity of individual cetis staff on twitter; partly due to resource issues. We have been quite content with the neutral (or perhaps more accurate, silent) voice of the account, and not following back. We don’t see it as the “face” of Cetis, or want to spend time developing a corporate personality. However it’s always good to get some feedback.

Now Martin Hawksey is part of the Cetis team, we’ve been having some really interesting conversations around the @jisccetis twitter account – backed up of course by some of Martin’s google spreadsheet analytics. So whilst we’ve been content with our automatic workflow, from the other side it’s not always that useful for others. As Martin pointed out, he’s un-followed and re-followed the account several times, mainly because there needs to be some reciprocation. Why follow an account that doesn’t follow you back? What do you get out of that? It’s not great for your vanalytics.

So, change number 1, @jisccetis is following people now. Armed now with our found new twitter and google intelligence, we have a much clearer idea of who is retweeting our posts and driving traffic to our blogs and generally sharing our “stuff”. A pause here to say a big thank you to @nopiedra, @sarahknight, and @drdjwalker! Change number 2, we’re going to make concerted effort to say thank you to people more often for sharing our work.

@jisccetis isn’t about to becoming a coffee drinking, weather sharing kind of account tho’ ;-) It will still be primarily informational, but we are now also going to start listing followers where possible, and hopefully make the @jisccetis twitter page a bit more useful too.
We’re not concerned with measuring our twitter activity based on solely on increasing numbers – we don’t need half a million followers. What we are concerned with is ensuring that we are engaging with key members of our community, and also discovering what other communities we are tapping into, or not tapping into. Martin’s spreadsheets, and the announcement from Google about integrating social network data into google analytics earlier this week will invaluable for us evolve our approach to using twitter more effectively both for us and our followers. We’ll also be sharing our experiences, and our thoughts on using the data we’re collecting over the coming months.

Curriculum Design Technical Journeys: Part 1

This is the first of a series of posts summarizing the technical aspects of the JISC
Curriculum Design Programme, based on a series of discussions between CETIS and the projects. These yearly discussions have been annotated and recorded in our PROD database.

The programme is well into its final year with projects due to finish at the end of July 2012. Instead of a final report, the projects are being asked to submit a more narrative institutional story of their experiences. As with any long running programme, in this instance, four years, a lot has changed since the projects started both within institutions themselves and in the wider political context the UK HE sector now finds itself.

At the beginning of the programme, the projects were put into clusters based on three high level concepts they (and indeed the programme) were trying to address

• Business processes – Cluster A
• Organisational change – Cluster B
• Educational principles/curriculum design practices – Cluster C

I felt that it would be useful to summarize my final thoughts or my view of overall technical journey of the programme – this maybe a mini epic! This post will focus on the Cluster C projects, OULDI (OU), PiP (University of Strathclyde) and Viewpoints (University of Ulster). These projects all started with explicit drivers based on educational principles and curriculum design practices.

OULDI (Open University Learning Design Initiative)
*Project Prod Entry
The OULDI project, has been working towards “ . . .develop and implement a methodology for learning design composed of tools, practice and other innovation that both builds upon, and contributes to, existing academic and practioner research.”

The team have built up an extensive toolkit around the design process for practitioners, including: Course Map template, Pedagogical Features Card Sort, Pedagogy Profiler and Information Literacies Facilitation Cards.

The main technical developments for the project have been the creation of the Cloudworks site and the continued development of theCompendium LD learning design tool.

Cloudworks, and its open source version CloudEngine is one of the major technical outputs for the programme. Originally envisioned as a kind of flickr for learning designs, the site has evolved into something slightly different “a place to share, find and discuss learning and teaching ideas and experiences.” In fact this evolution to a more discursive space has perhaps made it a far more flexible and richer resource. Over the course of the programme we have seen the development from the desire to preview learning designs to last year LAMS sequences being fully embedded in the site; as well as other embedded resources such as video diaries from the teams partners.

The site was originally built in Drupal, however the team made a decision to switch to using Codeigniter. This has given them the flexibility and level control they felt they needed. Juliette Culver has written an excellent blog post about their decision process and experiences.

Making the code open source has also been quite a learning curve for the team which they have been documenting and they plan to produce at least one more post aimed at developers around some of the practical lessons they have learned. Use of Cloudworks has been growing, however take up of the open-source version hasn’t been quite as popular an option. I speculated with the team that perhaps it was simply because the original site is so user-friendly that people don’t really see the need to host their own version. However I think that having the code available as open source can only be a “good thing”, particularly for a JISC funded project. Perhaps some more work on showing examples of what can be done with the API (e.g. building on the experiments CETIS did for our 2010 Design Bash ) might be a way to encourage more experimentation and integration of parts of the site in other areas, which in turn might led to the bigger step of implementing a stand alone version. That said, sustaining the evolution of Cloudworks is a key issue for the team. In terms of internal institutional sustainability there is now commitment to it and it has being highlighted in various strategy papers particularly around enhancing staff capability.

Compendium LD has also developed over the programme life-cyle. Now PC, Mac and Linux versions are available to download. There is also additional help built into the tool linking to Cloudworks, and a prototype areas for sharing design maps . The source code is also available under a GNU licence. The team have created a set of useful resources including a useful video introduction, and a set of user guides. It’s probably fair to say that Compendium LD is really for “expert designers”, however the team have found the icon set used in the tool really useful in f2f activities around developing design literacies and using them as part of a separate paper-based output.

Viewpoints
*Project Prod Entry

The project focus has focused on the development and facilitation of its set of curriculum re-design workshops. “We aim to create a series of user-friendly reflective tools for staff, promoting and enhancing good curriculum design.”

The Viewpoints process is now formally embedded the institutional course re-validation process. The team are embarking on a round of ‘train the trainer’ workshops to create a network of Viewpoints Champions to cascade throughout the University. A set of workshop resource packs are being developed which will be available via a booking system (for monitoring purposes) through the library for the champions. The team have also shared a number of outputs openly through a variety of channels including delicious , flickr and slideshare.

The project has focused on f2f interactions, and are using now creating video case studies from participants which will be available online over the coming months. The team had originally planned on building an online narration tool to complement (or perhaps even replace) the f2f workshops. However they now feel that the richness of the workshops could not be replaced with an online version. But as luck would have it, the Co-Educate project is developing a widget based on the 8-LEM model, which underpins much of the original work on which Viewpoints evolved, and so the project is discussing ways to input and utilize this development which should be available by June.

Early in the project, the team explored some formal modelling approaches, but found that a lighter weight approach using Balsamiq particularly useful for their needs. It proved to be effective both in terms of rapid prototyping and reducing development time, and getting useful engagement from end users. Balsamiq, and the rapid prototyping approach developed through Viewpoints is now being used widely by the developers in other projects for the institution.

Due to the focus on developing the workshop methodology there hasn’t been as much technical integration as originally envisaged. However, the team has been cognisant of institutional processes and workflows. Throughout the project the team have been keen to enable and build on structured data driven approaches allowing data to be easily re-purposed.

The team are now involved in the restructuring of a default course template area for all courses in their VLE. The template will pull in a variety of information sources from the library, NSS, assignment dates as well as a number of the frameworks and principles (e.g. assessment) developed through the project. So there is a logical progression from the f2f workshop, to course validation documentation, to what the student is presented with. Although the project hasn’t formally used XCRI they are noting growing institutional interest in it and data collection in general.

The team would like to continue with a data driven approach and see the development of their timetabling provision to make it more personalised for students.

PiP (Principles in Patterns)
*Project Prod Entry
The aims of the PiP project are:
(i) develop and test a prototype on-line expert system and linked set of educational resources that, if adopted, would:
· improve the efficiency of course and class approval processes at the University of Strathclyde
· help stimulate reflection about the educational design of classes and courses and about the student experiences they would promote
· support the alignment of course and class provision with institutional policies and strategies

(ii) use the findings from (i) to share lessons learned and to produce a set of recommendations to the University of Strathclyde and to the HE sector about ways of improving class and course approval processes

Unlike OULDI and Viewpoints, this project was less about f2f engagement supporting staff development in terms of course design, and focused on designing and building a system built on educationally proven methodology (e.g. The Reap Project). In terms of technical outputs, in some ways the outputs and experiences of the team actually mirrored more of those from the projects in Cluster B as PiP, like T-SPARC has developed a system based on Sharepoint, and like PALET has used Six Sigma and Lean methodologies.

The team have experimented extensively with a variety of modelling approaches, from UML and BPMN via a quick detour exploring Archi, for their base-lining models to now adopting Visio and the Six Sigma methodology. The real value of modelling is nearly always the conversations the process stimulates, and the team have noticed a perceptible change within the institution around attitudes towards, and the recognition of the importance of understanding and sharing core business processes. The project process workflow diagram is one I know I have found very useful to represent the complexity of course design and approval systems.

The team now have a prototype system, C-CAP, built on Sharepoint which is being trialled at the moment. The team are currently reflecting on the feedback so far via the project blog. This recent post outlines some of the divergent information needs within the course design and approval process. I’m sure many institutions could draw parallels with these thoughts and I’m sure the team would welcome feedback.

In terms of the development of the expert system, they team has had to deal with a number of challenges in terms of the lack of institutional integration between systems. Sharepoint was a common denominator, and so an obvious place to start. However, over the course of the past few years, there has been a re-think about development strategies. Originally it was planned to build the system using a .Net framework approach. Over the past year the decision was made to change to take an InfoPath approach. In terms of sustainability the team see this as being far more effective and hope to see a growing number of power users as apposed to specialist developers, which the .Net approach would have required. The team will be producing a blog post sharing the developers experience of building the system through the InfoPath approach.

Although the team feel they have made inroads around many issues, they do still see issues institutionally particularly around data collection. There is still ambiguity about use of terms such as course, module, programme between faculties. Although there is more interest in data collection in 2012 than in 2008 from senior management, there is still some work to be done around the importance and need for consistency of use.

So from this cluster, a robust set of tools for engaging practitioners with resources to help kick start the (re) design process and a working prototype to move from the paper based resources into formal course approval documentation.

A Conversation Around the Digital University – Part 4

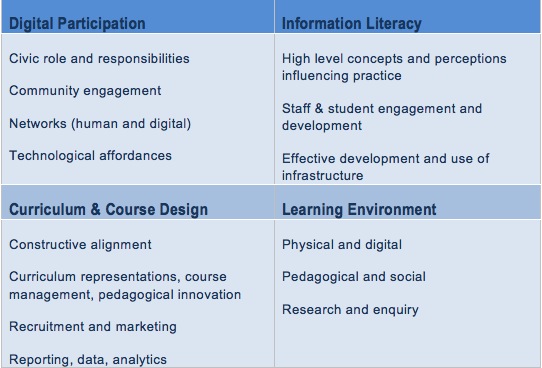
Continuing our discussions (introduction, part 2, part 3) around concepts of a Digital University, in this post we are going to explore the Curriculum and Course Design quadrant of our conceptual model.

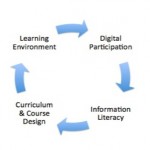
To reiterate,the logic of our overall discussion starts with the macro concept of Digital Participation which provides the wider societal backdrop to educational development. Information Literacy enables digital participation and in educational institutions is supported by Learning Environments which are themselves constantly evolving. All of this has significant implications for Curriculum and Course Design.

Observant readers will have noticed that we have “skipped” a quadrant. However this is more down to my lack of writing the learning environment section, and Bill having completed this section first :-) However, we hope that this does actually illustrate the iterative and cyclical nature of the model, allowing for multiple entry points.

MacNeill, Johnston Conceptual Matrix, 2012

MacNeill, Johnston Conceptual Matrix, 2012

Curriculum
Participation in university education, digital and otherwise, is normally based on people’s desire to learn by obtaining a degree, channelled in turn by their motivations e.g. school/college influences, improved career prospects, peer behaviour, family ambitions and the general social value ascribed to higher education. This approach includes adult returners taking Access routes, postgraduates and a variety of people taking short courses and accessing other forms of engagement.

All of these diverse factors combine to define the full nature of curriculum in higher education and argue for a holistic view of curriculum embracing “ …content, pedagogy, process, diversity and varied connections to the wider social and economic agendas…” ( Johnston 2010, P111). Such a holistic view fits well to the aspect of participation in our matrix, since it encompasses not only actual participants, but potential participants as befits modern notions of lifelong and life wide learning, whilst also acknowledging the powerful social and political forces that canalize the nature and experience of higher education. These latter forces have been omnipresent over the last 30 years in the near universal assumption that the overriding point of higher education is to provide ‘human capital’ in pursuit of economic growth.

University recruitment and selection procedures are the gateway to participation in degree courses and on admission initiate student transition experiences, for example the First Year Experience (FYE). Under present conditions, with degrees mainly shaped by disciplinary divisions, subject choice is the primary curriculum question posed by universities, with all other motivations and experiences constellated around the associated disciplinary differences in academic traditions, culture, departmental priority, pedagogy and choice of content. Other candidates for inclusion – employability skills, information literacy, even ethics and epistemological development have tended to be clearly subordinate to the power of disciplinary teaching.

Course Design
Despite 30 years of technological changes, the appearance of new disciplines, and mass enrolments, the popular image of a university degree ‘course’ has remained remarkably stable. Viewed from above we might see thousands of people entering buildings (some medieval, some Victorian, some modern), wherein they ‘become’ students, organized into classes/years of study and coming under the tutelage of subject-expert lecturers. Lectures, tutorials and labs, albeit larger and more technologically enhanced, can look much as they would have done in our grandparent’s day. Assuming our grandparents participated of course.

Looking at degrees in this rather superficial way, we could be accused of straying into the territory recently criticized by Michael Gove, whose attacks on ‘Victorian’ classrooms and demands for change and ‘updating’ of learning via computers and computer science have been widely reported and critiqued.

Our contention is that Gove and others like him have fallen into the trap of focussing on some of the contingent, surface features of daily activity in education and mistaken them for a ‘course’. Improvement in this universe is typically assumed to involve adoption of the latest technology linked to more ‘efficient’ practices. John Biggs (2007) has provided a popular alternative account of what constitutes a good university education by coining the notion of ‘constructive alignment’, which combines key general structural elements of a course – learning objectives, teaching methods, assessment practices and overall evaluation – with advocacy of a form of teaching for learning, distilled here as ‘social constructivism’. This form of learning emphasises the necessity of students learning by constructing meaning from their interactions with knowledge, and other learners, as opposed to simply soaking up new information, like so many inert, individual sponges. In this view, improving education is more complex and complicated than any uni-dimensional technological innovation and involves the alignment of all facets of course design in order to entail advanced learning. Debate is often focussed by terms like: active learning; inquiry based learning etc. accompanied by trends such as in-depth research and development of specific course dimensions such as assessment in particular.

Whist one can debate Biggs’ approach, and we assume some of you will, his work has been influential in university educational development, lecturer education and quality enhancement over several decades. From our perspective, his approach is useful in highlighting the critical importance of treating course design (and re-design) as the key strategic unit of analysis, activity and management in improving the higher education curriculum, as opposed to the more popular belief that it is the academic qualifications and classroom behaviour of lecturers or the adoption of particular technologies, for example, which count most. The current JISC funded Institutional Approaches to Curriculum Design Programme is providing another level of insight into the multiple aspects of curriculum design.

Connections & Questions
Chaining back through our model/matrix, we can now assert:

1. That strategic and operational management of learning environment must be a function of course design/re-design and not separate specialist functions within university organizations. This means engaging all stakeholders in the ongoing re-design of all courses to an agreed plan of curriculum renovation.

2. That education for information literacy must be entailed in the learning experiences of all students (and staff) as part of the curriculum and must be grounded in modern views of the field. Which is precisely what JISC is encouraging and supporting through its current Developing Digital Literacies Programme.

3. That participation in all its variety and possibility is a much more significant matter than simple selection/recruitment of suitably qualified people to existing degree course offerings. The nature of a university’s social engagement is exposed by the extent to which the full range of possible engagements and forms of participation are taken into account. For example is a given university’s strategy for participation mainly driven by the human capital/economic growth rationale of higher education, or are there additional/ alternative values enacted?

As ever, we’d appreciate any thoughts, questions and feedback you have in the comments.

*Part 2
*Part 3
*

Learning Analytics, where do you stand?

For? Against? Not bovvered? Don’t understand the question?

The term learning analytics is certainly trending in all the right ways on all the horizons scans. As with many “new” terms there are still some mis-conceptions about what it actually is or perhaps more accurately what it actually encompasses. For example, whilst talking with colleagues from the SURF Foundation earlier this week, they mentioned the “issues around using data to improve student retention” session at the CETIS conference. SURF have just funded a learning analytics programme of work which closely matches many of the examples and issues shared and discussed there. They were quite surprised that the session hadn’t be called “learning analytics”. Student retention is indeed a part of learning analytics, but not the only part.

However, back to my original question and the prompt for it. I’ve just caught up with the presentation Gardner Campbell gave to the LAK12 MOOC last week titled “Here I Stand” in which he presents a very compelling argument against some of the trends which are beginning to emerge in field of learning analytics.

Gardner is concerned that there is a danger of that the more reductive models of analytics may actually force us backwards in our models of teaching and learning. Drawing an analogy between M theory – in particular Stephen Hawkins description of there being not being one M theory but a “family of theories” – and how knowledge and learning actually occur. He is concerned that current learning analytics systems are based too much on “the math” and don’t actually show the human side of learning and the bigger picture of human interaction and knowledge transfer. As he pointed out “student success is not the same as success as a student”.

Some of the rubrics we might be tempted to use to (and in cases already are) build learning analytics systems reduce the educational experience to a simplistic management model. Typically systems are looking for signs pointing to failure, and not for the key moments of success in learning. What we should be working towards are system(s) that are adaptive, allow for reflection and can learn themselves.

This did make me think of the presentation at FOFE11 from IBM about their learning analytics system, which certainly scared the life out of me and many other’s I’ve spoken too. It also raised a lot of questions from the audience (and the twitter backchannel) about the educational value of the experience of failure. At the same time I was reflecting on the whole terminology issue again. Common understandings – why are they so difficult in education? When learning design was the “in thing”, I think it was John Casey who pointed out that what we were actually talking about most of the time was actually “teaching design”. Are we in danger of the same thing happening to the learning side of learning analytics being hi-jacked by narrower, or perhaps to be fairer, more tightly defined management and accountability driven analytics ?

To try and mitigate this we need to ensure that all key stakeholders are starting to ask (and answering) the questions Gardner raised in his presentation. What are the really useful “analytics” which can help me as a learner, teacher, administrator, etc? Which systems provide that data just now ? How can/do these stakeholders access and share the data in meaningful ways? How can we improve and build on these systems in ways which take into account the complexity of learning? Or as Gardner said, how can we start framing systems and questions around wisdom? But before we can do any of that we need to make sure that our stakeholders are informed enough to take a stand, and not just have to accept whatever system they are given.

At CETIS we are about to embark on an analytics landscape study, which we are calling an Analytics Reconnoitre. We are going to look at the field of learning analytics from a holistic perspective, review recent work and (hopefully) produce some pragmatic briefings on the who, where, why, what and when’s of learning analytics and point to useful resources and real world examples. This will build and complement work already funded by JISC such as the Relationship Management Programme, the Business Intelligence Infokit and the Activity Data Programme synthesis. We’ll also be looking to emerging communities of practice, both here in the UK and internationally to join up on thinking and future developments. Hopefully this work will contribute to the growing body of knowledge and experience in the field of learning analytics and well as raising some key questions (and hopefully some answers) around around its many facets.

My open education week

As you are now doubt aware, this week is Open Education Week. I’ve been enjoying following various activities, including some great contributions and thoughts from JISC colleagues. But on a more personal level, I was delighted to get an confirmation email yesterday that the Stanford open course on Natural Language Processing is starting next week.

I signed up for this course, as I thought their first course on AI (see Adam’s interview with Seb Schmoller for more details ) would be beyond my capabilities. I’m also becoming more and more interested in NPL, through conversations with my David Sherlock around techniques for getting more analysis and visualisations from the data in our PROD database; and also from Adam’s recent presentation and blog post around his experiments with Cetis staff blogs.

I’ve just watched the introductory video, which simultaneously excited and slightly scared me as there are weekly programme tasks – looks like I’ll need to catch up on my open code academy lessons too.

One man and his spreadsheet, a gephi wizard and the voice of reason

Is how I would sum up the speakers at the Social Network Analysis session at #cetis12.

I started the session by giving a very brief overview of SNA and tried to highlight why I think it is important, particularly to an organisation such as CETIS, who stakes quite a bit of of its reputation on its ability to network (see this post for some more of my thoughts around this). Using SNA we are now able to actually see and share our existing connections and, potentially any gaps.

I am always inspired by (and slightly in awe of) the work of both Tony and Martin in visualising communities, however I am always aware of the skills gap between their levels of competency and my own. So, I also wanted to raise the issue of “just in time/just enough” tools. Sometimes a quick snap shot of activity is really effective and all that’s needed. There’s also the issue of interpretation and common understandings.

Whilst visualisations can in many cases illustrate complex connections more eloquently than words, there are also cases, particularly around more complex visualisations where some common understandings of the models being used to create the visualisations and the data sources are required. A case in point was Adam Cooper’s opening presentation at the conference where he showed some examples of text mining and analysis of CETIS blog post. This provoked quite a bit of chin stroking twitter back-channel activity. I think this illustrats some of potential dangers around presenting what can appear to be an objective view of things which is based on subjective data. As I knew more about the data Adam’s presentation raised lots of really interesting questions for me, but another danger of social media is that twitter is often not the best medium to have an informed discussion.

Martin Hawskey’s (a man quite possibly on a mission to take over the world via google spreadsheets) presentation opened up the session from just SNA to a wider data discussion by highlighting some examples of data journalism, which have very effectively combined visualisation techniques and contextualisation. Martin then took us through some of the work he has recently been doing for JISC and CETIS in visualising activity around the UK OER projects.

Tony Hirst, aka the gephi wizard, then gave us a masterclass on data visualisation techniques, showing us how visualisations can provide “at a glance or macroscopic” views of huge datasets; which he encapsulated by the d3i model – data,information, intelligence, insight. As well as a sharing variety of examples from MPs expenses to Formula 1 racing to Brian Kelly, Tony has also been working with Alan Cann (University of Leicester) to visualise connections between students using Google+. Unfortunately Alan couldn’t be attend the session in person but he did share this video about their work. I’m looking forward to hearing more about this use of SNA in a real teaching and learning context.

Amber Thomas followed with a very balanced presentation “Lies, damed lies and pretty pictures” which gave a very balanced and but still thought provoking view on how we should be thinking about using the network and data analysis techniques. My colleague David Sherlock has blogged some thoughts on Amber’s presentation too. Amber highlighted some key tactics which included:
*reducing our fear of numbers
*being generous with our data ( and remembering who actually owns the data)
*combining data and effort to work faster /more effectively across the sector

We then had some live analysis of data being driven via the conference #cetis12 hashtag – again what one man can do with a spreadsheet is quite amazing! You can see the results in the CETIS 12 TAGSExplorer.

TAGSExplorer of #cetis12

TAGSExplorer of #cetis12

More information on the session, and links to all the presentations are available by following this link.

App Stores Galore at #cetis12

Over the last two months, The Open University, the University of Bolton, KU Leuven, and IMC, with funding from JISC, have been working to develop a Widget Store aimed at the UK education sector using a codebase shared across and sustained by a range of other EU projects and consortia. (see Scott’s post for more details on the technical work and getting involved).

The Creating and Education App Store for the UK session at the CETIS conference, was the first opportunity for the team to share, firstly the vision of a shared codebase to underpin a range of existing and potential widget stores. And secondly, to share initial prototypes of UIs, and get feedback on the work to date and potential future development ideas from delegates.

Fridolin Wild (OU) gave a useful overview presentation “the university in a box” which highlighted the work of the OU in various widget related projects and initiatives which have built on the notion of the personalised learning environment.

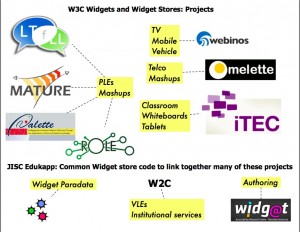
Scott Wilson, (University of Bolton/CETIS) then set the wider context of widget developments, from W3C o the JISC DVLE programme, which is neatly encapsulated in the diagram below.

W3C Widgets and Widget Store Projects

W3C Widgets and Widget Store Projects

One of the key parts of the work is to provide extended community building features such as ratings, comments, use cases etc. As well as providing additional support for users of the store(s), Scott also outlined plans to share this “paradata” via the JLeRN Learning Registry node (which was discussed as part of a parallel conference session).

Over the 3 hour session there was much discussion around three key areas:

1. Institutional use of such a store: e.g. how would you use such a store? Have a local installation or use a hosted services? Implement connectors using IMS LTI for example.

2. Tracking and Recommendation services: what would be captured? how would it be shared? How could useful analytics be captured and used?

3. Widget Authoring: led by the Widgat team a useful discussion centred around their widget authoring tool.

For the conference plenary a two slide summary was produced, and look out for more details on the store over the coming months on this blog.

A Conversation Around the Digital University: Part 3

Following our introductory post and our last post on Digital Participation, in this post we are going to explore the Information Literacy quadrant of our conceptual model.

To reiterate,the logic of our overall discussion starts with the macro concept of Digital Participation which provides the wider societal backdrop to educational development. Information Literacy enables digital participation and in educational institutions is supported by Learning Environments which are themselves constantly evolving. All of this has significant implications for Curriculum and Course Design.

MacNeill, Johnston Conceptual Matrix, 2012

MacNeill, Johnston Conceptual Matrix, 2012

Information Literacy
As we stated in our introductory post, our perspective is rooted in Information Literacy. We believe it is a key field to be deployed in developing digital infrastructure in universities. For our purposes Information Literacy can be described both narrowly, as a set of personal skills and approaches to better acquisition and use of information, and more broadly as a social construct arising from notions of the both the knowledge economy and information society.

In the broader perspective, UNESCO is in the vanguard of deploying the term in relation to media, citizenship and education by asserting Information Literacy as a key requirement of participation in learning, employment and democracy. The Alexandria Proclamation (2006) states that information literacy:

• comprises the competencies to recognize information needs and to locate, evaluate, apply and create information within cultural and social contexts;

• is crucial to the competitive advantage of individuals, enterprises (especially small and medium enterprises), regions and nations;

• provides the key to effective access, use and creation of content to support economic development, education, health and human services, and all other aspects of contemporary societies, and thereby provides the vital foundation for fulfilling the goals of the Millennium Declaration and the World Summit on the Information Society; and

• extends beyond current technologies to encompass learning, critical thinking and interpretative skills across professional boundaries and empowers individuals and communities.”
More practical information can also be found in Woody Horton’s Information Literacy Primer.

Whilst these concerns are driven by the growth of technologies and the internet, they are channelled by a need to expand our notions of literacy beyond the basics of reading/writing, to include media and information (UNESCO Decade of Literacy 2003-12).

Thus whilst technological change in the production and consumption of information content is a fundamental factor, it is not allowed to obscure the importance of developing the educational, ethical and democratic dimension of the digital society.

Personal Skills and Strategies of Information Literacy
Information Literacy is portrayed in terms of improving the information behaviours required to access and search various information systems to extract and use information for social, economic and educational purposes. This approach has been developed to a high level of definition and practical application in education, research and professional practice e.g. competency frameworks such as the SCOUNL Seven Pillars and ACRL and definitions by bodies such as CILIP .

There is a clear message that simply using information tools and services is insufficient to develop the full range of skills and also understanding of the legal/ethical issues involved. Education for Information Literacy is therefore a key aim, which requires further development, and has been gaining attention in HE for several decades.
These authors deal with the following key issues:

*Staff perception Webber and Johnston
*Student experience Lupton
*Course Design and assessment Bruce, Edwards, Lupton.

Clearly Information Literacy does not exist in a vacuum. For educational purposes the question of learning environment is essential, particularly with increasing use of digital environments, which inevitably stimulates a need to understand information and information behaviour more explicitly. This will be the topic of our next post.

*Part 4

NMC 2012 HE Horizon Report – there’s an app for that

Well not quite an app for the report itself which has just been published, but there is now a weekly HZ EdTech Weekly App, as well as a useful short video summarising the key technologies identified in this years report. Mobile apps and tablet computing top the near time adoption trends, game based learning and learning analytics the mid-term and gesture based computing and the internet of things (particularly smart objects) are in furthest term of 4-5 years.

The report itself is also available via iTunes under a creative commons licence.

You can watch the video and download the report and app by following this link

A Conversation around the Digital University – Part 2

Following on from our introductory “A conversation around what it means to be a digital university” post, we are now going to start to look in more detail at the matrix we introduced.

Information literacy based planning matrix

We believe that these four high level headings are key for strategic conceptualization for a 21st Century University. Below is the expanded matrix.

MacNeill, Johnston Conceptual Matrix, 2012

MacNeill, Johnston Conceptual Matrix, 2012

The logic of our discussion starts with the macro concept of Digital Participation which provides the wider societal backdrop to educational development. Information Literacy enables digital participation and in educational institutions is supported by Learning Environments which are themselves constantly evolving. All of this has significant implications for Curriculum and Course Design. We see educational development as the primary channel to unite the elements of our conceptualisation.

Over the coming weeks, we will expand on each of the four quadrants, starting with this post which focuses on Digital Participation.

Digital Participation
We have used the term digital participation, as we feel that it is a more inclusive term than digital literacy. Digital participation is a broader social construct with varied implications for educators. As we pointed out in our previous post the term digital literacy currently lacks a clear consensus of opinion. It could be interpreted as almost anything to do with ‘the digital’ and this may lead to the cognoscenti having widely different views, albeit tightly understood amongst themselves, from the more numerous members of the population, who don’t have such a professional interest. This issue arose at the start up meeting of the JISC Developing Digital Literacies Programme, where there was recognition that the definition of digital literacy used in the programme may not be commonplace in HE and indeed with the strategic partners for the programme.

In the UK, both the Westminster and the Scottish Governments are recognising and encouraging digital participation across all sectors of society and emphasising the notion of the “digital citizen” e.g. increasing use of web-based consultation exercises, increased moves towards the notion of Open Government. Digital participation, in this context, can be seen as a fundamental part of any knowledge economy or information based democracy and therefore has substantial implications for educators. Digital participation needs to be optimized to ensure continued economic growth in parallel with the development of an informed, literate citizenship. Universities (and indeed the whole education sector) are uniquely placed to lead and evolve this kind of participation for and with their wider communities.

However there are problems with this scenario in that digital ‘coverage’ of the population is patchy, organizations are still finding their way with digital realities. Rapid changes in technology are forcing universities to make decisions based often on purely technological grounds, or delaying decisions for the same reason. It is these issues, particularly related to HE, that our conceptual matrix seeks to address by providing a holistic tool with which to question strategic planning and institutional provision and development.

For the Digital Participation quadrant of our matrix we have identified the following aspects:

• Civic role and responsibilities – how does access to digital resources underpin civic action?
• Community engagement – how can we facilitate more and better engagement between communities?
• Networks (human and digital) – what networks do we need foster?
• Technological affordances – what are the underlying infrastructures and connections underpinning access to all of the above?

Of course, digital participation hinges on information literacy, which will be the focus of our next post. But in the meantime, what do you think? Have we identified the key concepts around digital participation?

*Part 3
*Part 4
*